Gene Page: HECW1
Summary ?
| GeneID | 23072 |
| Symbol | HECW1 |
| Synonyms | NEDL1 |
| Description | HECT, C2 and WW domain containing E3 ubiquitin protein ligase 1 |
| Reference | MIM:610384|HGNC:HGNC:22195|HPRD:11385| |
| Gene type | protein-coding |
| Map location | 7p13 |
| Pascal p-value | 0.822 |
| Fetal beta | -0.311 |
| DMG | 1 (# studies) |
| eGene | Myers' cis & trans |
Gene in Data Sources
| Gene set name | Method of gene set | Description | Info |
|---|---|---|---|
| CV:GWASdb | Genome-wide Association Studies | GWASdb records for schizophrenia | |
| CV:PGCnp | Genome-wide Association Study | GWAS | |
| DMG:Wockner_2014 | Genome-wide DNA methylation analysis | This dataset includes 4641 differentially methylated probes corresponding to 2929 unique genes between schizophrenia patients (n=24) and controls (n=24). | 2 |
Section I. Genetics and epigenetics annotation
 Differentially methylated gene
| Probe | Chromosome | Position | Nearest gene | P (dis) | Beta (dis) | FDR (dis) | Study |
|---|---|---|---|---|---|---|---|
| cg02050028 | 7 | 43156037 | HECW1 | 1.68E-5 | 0.63 | 0.015 | DMG:Wockner_2014 |
| cg08039116 | 7 | 43152254 | HECW1 | 7.13E-5 | -0.401 | 0.025 | DMG:Wockner_2014 |
eQTL annotation
| SNP ID | Chromosome | Position | eGene | Gene Entrez ID | pvalue | qvalue | TSS distance | eQTL type |
|---|---|---|---|---|---|---|---|---|
| rs17542055 | chr7 | 42652803 | HECW1 | 23072 | 0.18 | cis |
Section II. Transcriptome annotation
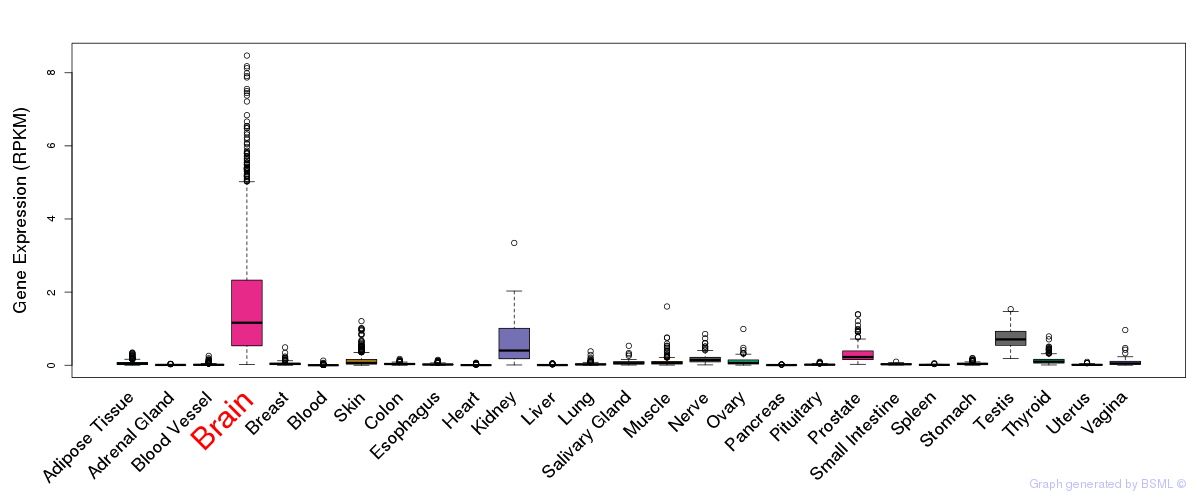
General gene expression (GTEx)
Gene expression during devlopment (BrainCloud)
Footnote:
A total of 269 time points ploted, with n=38 fetal samples (x=1:38). Each triangle represents one time point.
Gene expression of temporal and spatial changes (BrainSpan)
Footnote:
SC: sub-cortical regions; SM: sensory-motor regions; FC: frontal cortex; and TP: temporal-parietal cortex
ST1: fetal (13 - 26 postconception weeks), ST2: early infancy to late childhood (4 months to 11 years), and ST3: adolescence to adulthood (13 - 23 years)
The bar shown representes the lower 25% and upper 25% of the expression distribution.
Top co-expressed genes in brain regions
| Top 10 positively co-expressed genes | ||
| Gene | Pearson's Correlation | Spearman's Correlation |
| KIAA1109 | 0.92 | 0.94 |
| KIAA0232 | 0.91 | 0.93 |
| EIF4G3 | 0.91 | 0.92 |
| RSC1A1 | 0.91 | 0.93 |
| YTHDC2 | 0.91 | 0.92 |
| ANKRD28 | 0.90 | 0.91 |
| UBR2 | 0.90 | 0.91 |
| MAP3K4 | 0.90 | 0.91 |
| C9orf102 | 0.90 | 0.93 |
| USP7 | 0.90 | 0.90 |
| Top 10 negatively co-expressed genes | ||
| Gene | Pearson's Correlation | Spearman's Correlation |
| AF347015.21 | -0.73 | -0.70 |
| FXYD1 | -0.72 | -0.67 |
| HIGD1B | -0.71 | -0.71 |
| AF347015.31 | -0.71 | -0.69 |
| ENHO | -0.71 | -0.77 |
| MT-CO2 | -0.71 | -0.69 |
| C1orf54 | -0.68 | -0.74 |
| METRN | -0.68 | -0.70 |
| IFI27 | -0.68 | -0.67 |
| VAMP5 | -0.68 | -0.69 |
Section V. Pathway annotation
| Pathway name | Pathway size | # SZGR 2.0 genes in pathway | Info |
|---|---|---|---|
| GAUSSMANN MLL AF4 FUSION TARGETS D UP | 38 | 23 | All SZGR 2.0 genes in this pathway |
| HU ANGIOGENESIS UP | 21 | 16 | All SZGR 2.0 genes in this pathway |
| FIRESTEIN PROLIFERATION | 175 | 125 | All SZGR 2.0 genes in this pathway |
| MIKKELSEN NPC HCP WITH H3K27ME3 | 341 | 243 | All SZGR 2.0 genes in this pathway |
| MARTENS BOUND BY PML RARA FUSION | 456 | 287 | All SZGR 2.0 genes in this pathway |