Gene Page: AVL9
Summary ?
| GeneID | 23080 |
| Symbol | AVL9 |
| Synonyms | KIAA0241 |
| Description | AVL9 cell migration associated |
| Reference | MIM:612927|HGNC:HGNC:28994|Ensembl:ENSG00000105778|HPRD:13788|Vega:OTTHUMG00000152929 |
| Gene type | protein-coding |
| Map location | 7p14.3 |
| Pascal p-value | 0.063 |
| Fetal beta | -0.448 |
| DMG | 1 (# studies) |
| eGene | Meta |
Gene in Data Sources
| Gene set name | Method of gene set | Description | Info |
|---|---|---|---|
| CV:PGCnp | Genome-wide Association Study | GWAS | |
| DMG:Jaffe_2016 | Genome-wide DNA methylation analysis | This dataset includes 2,104 probes/CpGs associated with SZ patients (n=108) compared to 136 controls at Bonferroni-adjusted P < 0.05. | 2 |
Section I. Genetics and epigenetics annotation
 Differentially methylated gene
| Probe | Chromosome | Position | Nearest gene | P (dis) | Beta (dis) | FDR (dis) | Study |
|---|---|---|---|---|---|---|---|
| cg24077501 | 7 | 32996869 | AVL9 | 1.26E-9 | -0.015 | 1.32E-6 | DMG:Jaffe_2016 |
| cg20743544 | 7 | 32982957 | AVL9 | 4.09E-9 | -0.024 | 2.49E-6 | DMG:Jaffe_2016 |
Section II. Transcriptome annotation
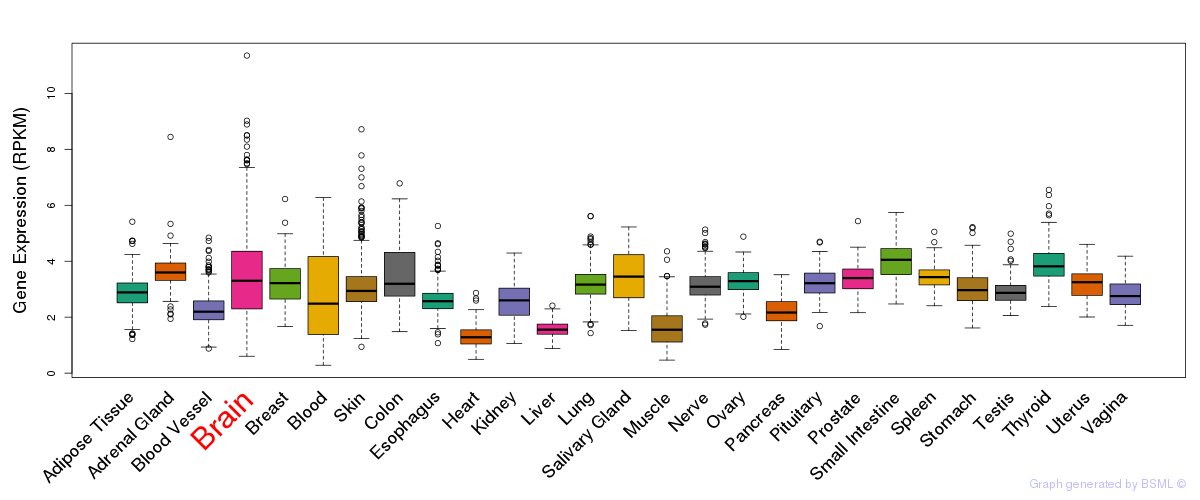
General gene expression (GTEx)
Gene expression during devlopment (BrainCloud)
Footnote:
A total of 269 time points ploted, with n=38 fetal samples (x=1:38). Each triangle represents one time point.
Gene expression of temporal and spatial changes (BrainSpan)
Footnote:
SC: sub-cortical regions; SM: sensory-motor regions; FC: frontal cortex; and TP: temporal-parietal cortex
ST1: fetal (13 - 26 postconception weeks), ST2: early infancy to late childhood (4 months to 11 years), and ST3: adolescence to adulthood (13 - 23 years)
The bar shown representes the lower 25% and upper 25% of the expression distribution.
Top co-expressed genes in brain regions
| Top 10 positively co-expressed genes | ||
| Gene | Pearson's Correlation | Spearman's Correlation |
| C1orf58 | 0.88 | 0.90 |
| KIAA0196 | 0.86 | 0.88 |
| MON2 | 0.86 | 0.88 |
| FRS2 | 0.86 | 0.89 |
| IPO8 | 0.85 | 0.87 |
| SETX | 0.85 | 0.88 |
| FNIP1 | 0.85 | 0.87 |
| FRYL | 0.84 | 0.87 |
| LARP4 | 0.84 | 0.87 |
| ITCH | 0.84 | 0.86 |
| Top 10 negatively co-expressed genes | ||
| Gene | Pearson's Correlation | Spearman's Correlation |
| IL32 | -0.57 | -0.59 |
| CXCL14 | -0.56 | -0.60 |
| IFI27 | -0.55 | -0.60 |
| AF347015.21 | -0.54 | -0.54 |
| MT-CO2 | -0.53 | -0.56 |
| ENHO | -0.53 | -0.63 |
| CSAG1 | -0.53 | -0.53 |
| FXYD1 | -0.52 | -0.56 |
| HIGD1B | -0.52 | -0.57 |
| C16orf14 | -0.51 | -0.62 |
Section V. Pathway annotation
| Pathway name | Pathway size | # SZGR 2.0 genes in pathway | Info |
|---|---|---|---|
| CHARAFE BREAST CANCER LUMINAL VS BASAL UP | 380 | 215 | All SZGR 2.0 genes in this pathway |
| HAHTOLA MYCOSIS FUNGOIDES CD4 DN | 116 | 71 | All SZGR 2.0 genes in this pathway |
| GAUSSMANN MLL AF4 FUSION TARGETS G UP | 238 | 135 | All SZGR 2.0 genes in this pathway |
| MCBRYAN PUBERTAL BREAST 5 6WK UP | 116 | 68 | All SZGR 2.0 genes in this pathway |
| DACOSTA UV RESPONSE VIA ERCC3 XPCS DN | 88 | 71 | All SZGR 2.0 genes in this pathway |
| DACOSTA UV RESPONSE VIA ERCC3 TTD DN | 84 | 63 | All SZGR 2.0 genes in this pathway |
| DACOSTA UV RESPONSE VIA ERCC3 DN | 855 | 609 | All SZGR 2.0 genes in this pathway |
| BENPORATH NANOG TARGETS | 988 | 594 | All SZGR 2.0 genes in this pathway |
| BENPORATH PROLIFERATION | 147 | 80 | All SZGR 2.0 genes in this pathway |
| GALE APL WITH FLT3 MUTATED UP | 56 | 35 | All SZGR 2.0 genes in this pathway |
| MOREAUX MULTIPLE MYELOMA BY TACI DN | 172 | 107 | All SZGR 2.0 genes in this pathway |
| KONDO EZH2 TARGETS | 245 | 148 | All SZGR 2.0 genes in this pathway |
| MITSIADES RESPONSE TO APLIDIN DN | 249 | 165 | All SZGR 2.0 genes in this pathway |
| CHEN HOXA5 TARGETS 9HR UP | 223 | 132 | All SZGR 2.0 genes in this pathway |
| CAIRO HEPATOBLASTOMA UP | 207 | 143 | All SZGR 2.0 genes in this pathway |
| BROWNE HCMV INFECTION 4HR DN | 254 | 158 | All SZGR 2.0 genes in this pathway |
| CHANGOLKAR H2AFY TARGETS UP | 48 | 28 | All SZGR 2.0 genes in this pathway |
| ZWANG TRANSIENTLY UP BY 1ST EGF PULSE ONLY | 1839 | 928 | All SZGR 2.0 genes in this pathway |