Gene Page: SSPO
Summary ?
| GeneID | 23145 |
| Symbol | SSPO |
| Synonyms | - |
| Description | SCO-spondin |
| Reference | HGNC:HGNC:21998|Ensembl:ENSG00000197558| |
| Gene type | protein-coding |
| Map location | 7q36.1 |
| Pascal p-value | 0.111 |
| Sherlock p-value | 0.818 |
| Fetal beta | -0.668 |
| eGene | Anterior cingulate cortex BA24 Caudate basal ganglia Cerebellar Hemisphere Cerebellum Cortex Frontal Cortex BA9 Hippocampus Nucleus accumbens basal ganglia Putamen basal ganglia Myers' cis & trans |
| Support | CompositeSet |
Gene in Data Sources
| Gene set name | Method of gene set | Description | Info |
|---|---|---|---|
| CV:PGCnp | Genome-wide Association Study | GWAS | |
| DNM:Fromer_2014 | Whole Exome Sequencing analysis | This study reported a WES study of 623 schizophrenia trios, reporting DNMs using genomic DNA. | |
| PMID:cooccur | High-throughput literature-search | Systematic search in PubMed for genes co-occurring with SCZ keywords. A total of 3027 genes were included. | |
| Literature | High-throughput literature-search | Co-occurance with Schizophrenia keywords: schizophrenia,schizophrenias | Click to show details |
Section I. Genetics and epigenetics annotation
 DNM table
| Gene | Chromosome | Position | Ref | Alt | Transcript | AA change | Mutation type | Sift | CG46 | Trait | Study |
|---|---|---|---|---|---|---|---|---|---|---|---|
| SSPO | chr7 | 149488605 | G | T | NM_198455 | p.1686G>C | missense | Schizophrenia | DNM:Fromer_2014 | ||
| SSPO | chr7 | 149489224 | C | A | NM_198455 | . | silent | Schizophrenia | DNM:Fromer_2014 |
eQTL annotation
| SNP ID | Chromosome | Position | eGene | Gene Entrez ID | pvalue | qvalue | TSS distance | eQTL type |
|---|---|---|---|---|---|---|---|---|
| rs631905 | chr17 | 26883312 | SSPO | 23145 | 0.18 | trans | ||
| rs149415796 | 7 | 149530494 | SSPO | ENSG00000197558.7 | 3.084E-8 | 0 | 57363 | gtex_brain_ba24 |
| rs6960187 | 7 | 149530894 | SSPO | ENSG00000197558.7 | 1.691E-8 | 0 | 57763 | gtex_brain_ba24 |
| rs6958235 | 7 | 149533883 | SSPO | ENSG00000197558.7 | 3.032E-8 | 0 | 60752 | gtex_brain_ba24 |
| rs57307418 | 7 | 149534216 | SSPO | ENSG00000197558.7 | 3.652E-8 | 0 | 61085 | gtex_brain_ba24 |
| rs1044805 | 7 | 149536503 | SSPO | ENSG00000197558.7 | 8.019E-8 | 0 | 63372 | gtex_brain_ba24 |
| rs57009176 | 7 | 149537423 | SSPO | ENSG00000197558.7 | 6.937E-8 | 0 | 64292 | gtex_brain_ba24 |
| rs2040906 | 7 | 149538150 | SSPO | ENSG00000197558.7 | 9.078E-8 | 0 | 65019 | gtex_brain_ba24 |
| rs79479930 | 7 | 149538553 | SSPO | ENSG00000197558.7 | 8.019E-8 | 0 | 65422 | gtex_brain_ba24 |
| rs6975030 | 7 | 149539072 | SSPO | ENSG00000197558.7 | 2.182E-7 | 0 | 65941 | gtex_brain_ba24 |
| rs6974897 | 7 | 149539138 | SSPO | ENSG00000197558.7 | 1.016E-7 | 0 | 66007 | gtex_brain_ba24 |
| rs10261977 | 7 | 149528262 | SSPO | ENSG00000197558.7 | 6.591E-7 | 0 | 55131 | gtex_brain_putamen_basal |
| rs10262226 | 7 | 149528392 | SSPO | ENSG00000197558.7 | 2.09E-6 | 0 | 55261 | gtex_brain_putamen_basal |
| rs149415796 | 7 | 149530494 | SSPO | ENSG00000197558.7 | 1.075E-11 | 0 | 57363 | gtex_brain_putamen_basal |
| rs6960187 | 7 | 149530894 | SSPO | ENSG00000197558.7 | 5.339E-15 | 0 | 57763 | gtex_brain_putamen_basal |
| rs6958235 | 7 | 149533883 | SSPO | ENSG00000197558.7 | 3.389E-10 | 0 | 60752 | gtex_brain_putamen_basal |
| rs57307418 | 7 | 149534216 | SSPO | ENSG00000197558.7 | 8.937E-10 | 0 | 61085 | gtex_brain_putamen_basal |
| rs1044805 | 7 | 149536503 | SSPO | ENSG00000197558.7 | 4.41E-9 | 0 | 63372 | gtex_brain_putamen_basal |
| rs57009176 | 7 | 149537423 | SSPO | ENSG00000197558.7 | 2.972E-12 | 0 | 64292 | gtex_brain_putamen_basal |
| rs2040906 | 7 | 149538150 | SSPO | ENSG00000197558.7 | 3.692E-12 | 0 | 65019 | gtex_brain_putamen_basal |
| rs79479930 | 7 | 149538553 | SSPO | ENSG00000197558.7 | 1.978E-9 | 0 | 65422 | gtex_brain_putamen_basal |
| rs6975030 | 7 | 149539072 | SSPO | ENSG00000197558.7 | 6.096E-11 | 0 | 65941 | gtex_brain_putamen_basal |
| rs6974897 | 7 | 149539138 | SSPO | ENSG00000197558.7 | 6.708E-11 | 0 | 66007 | gtex_brain_putamen_basal |
Section II. Transcriptome annotation
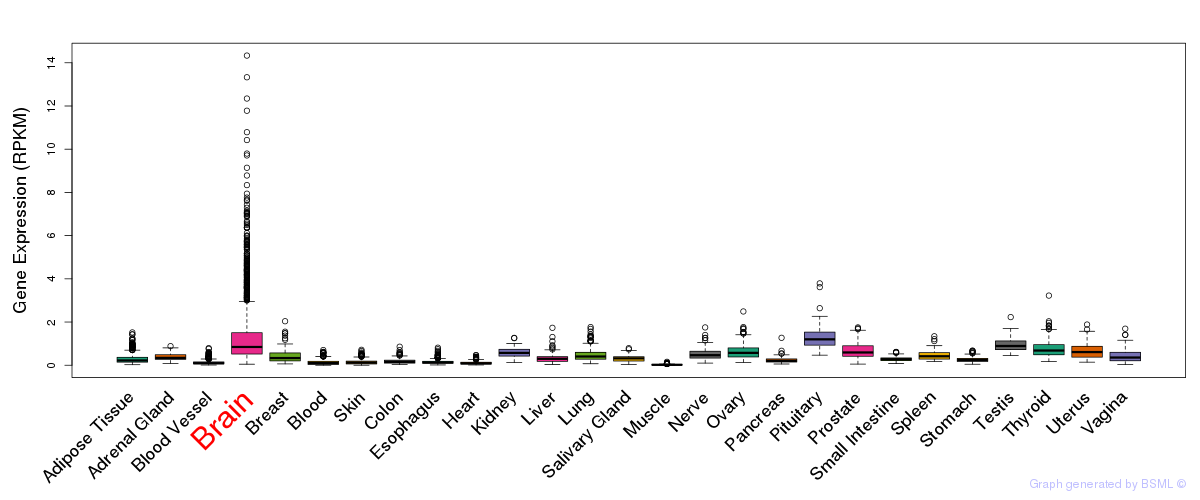
General gene expression (GTEx)
Gene expression during devlopment (BrainCloud)
Footnote:
A total of 269 time points ploted, with n=38 fetal samples (x=1:38). Each triangle represents one time point.
Gene expression of temporal and spatial changes (BrainSpan)
Footnote:
SC: sub-cortical regions; SM: sensory-motor regions; FC: frontal cortex; and TP: temporal-parietal cortex
ST1: fetal (13 - 26 postconception weeks), ST2: early infancy to late childhood (4 months to 11 years), and ST3: adolescence to adulthood (13 - 23 years)
The bar shown representes the lower 25% and upper 25% of the expression distribution.
Top co-expressed genes in brain regions
| Top 10 positively co-expressed genes | ||
| Gene | Pearson's Correlation | Spearman's Correlation |
| GARNL1 | 0.93 | 0.93 |
| APPL1 | 0.93 | 0.94 |
| AKAP10 | 0.93 | 0.92 |
| DDHD1 | 0.93 | 0.91 |
| BTRC | 0.92 | 0.93 |
| RAB3GAP2 | 0.92 | 0.94 |
| DMXL2 | 0.92 | 0.94 |
| CAB39 | 0.92 | 0.91 |
| TM9SF3 | 0.92 | 0.91 |
| CLCN3 | 0.92 | 0.92 |
| Top 10 negatively co-expressed genes | ||
| Gene | Pearson's Correlation | Spearman's Correlation |
| AF347015.21 | -0.67 | -0.62 |
| FXYD1 | -0.67 | -0.63 |
| HIGD1B | -0.66 | -0.65 |
| MT-CO2 | -0.66 | -0.63 |
| AF347015.31 | -0.65 | -0.63 |
| ENHO | -0.64 | -0.69 |
| METRN | -0.62 | -0.63 |
| CSAG1 | -0.62 | -0.59 |
| PLA2G5 | -0.62 | -0.62 |
| IFI27 | -0.62 | -0.61 |