Gene Page: EFR3A
Summary ?
| GeneID | 23167 |
| Symbol | EFR3A |
| Synonyms | - |
| Description | EFR3 homolog A |
| Reference | MIM:611798|HGNC:HGNC:28970|Ensembl:ENSG00000132294|HPRD:17179|Vega:OTTHUMG00000150552 |
| Gene type | protein-coding |
| Map location | 8q24.22 |
| Pascal p-value | 0.341 |
| Sherlock p-value | 0.663 |
| Fetal beta | -1.711 |
| DMG | 1 (# studies) |
| eGene | Myers' cis & trans Meta |
Gene in Data Sources
| Gene set name | Method of gene set | Description | Info |
|---|---|---|---|
| CV:PGCnp | Genome-wide Association Study | GWAS | |
| DMG:Jaffe_2016 | Genome-wide DNA methylation analysis | This dataset includes 2,104 probes/CpGs associated with SZ patients (n=108) compared to 136 controls at Bonferroni-adjusted P < 0.05. | 1 |
Section I. Genetics and epigenetics annotation
 Differentially methylated gene
| Probe | Chromosome | Position | Nearest gene | P (dis) | Beta (dis) | FDR (dis) | Study |
|---|---|---|---|---|---|---|---|
| cg01956158 | 8 | 132916947 | EFR3A | 2.17E-10 | -0.027 | 5.92E-7 | DMG:Jaffe_2016 |
eQTL annotation
| SNP ID | Chromosome | Position | eGene | Gene Entrez ID | pvalue | qvalue | TSS distance | eQTL type |
|---|---|---|---|---|---|---|---|---|
| rs2403775 | chr8 | 133472361 | EFR3A | 23167 | 0.08 | cis |
Section II. Transcriptome annotation
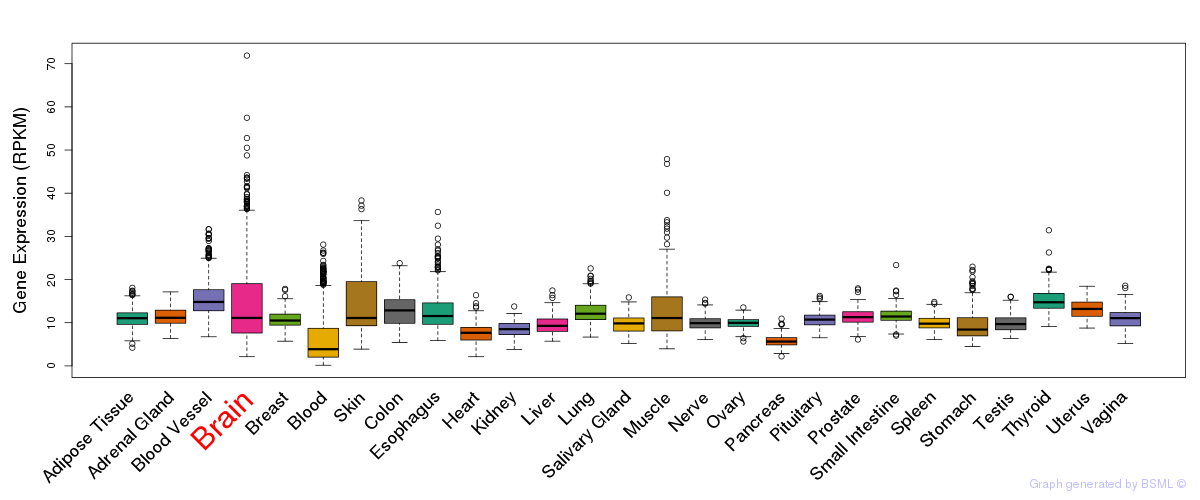
General gene expression (GTEx)
Gene expression during devlopment (BrainCloud)
Footnote:
A total of 269 time points ploted, with n=38 fetal samples (x=1:38). Each triangle represents one time point.
Gene expression of temporal and spatial changes (BrainSpan)
Footnote:
SC: sub-cortical regions; SM: sensory-motor regions; FC: frontal cortex; and TP: temporal-parietal cortex
ST1: fetal (13 - 26 postconception weeks), ST2: early infancy to late childhood (4 months to 11 years), and ST3: adolescence to adulthood (13 - 23 years)
The bar shown representes the lower 25% and upper 25% of the expression distribution.
Top co-expressed genes in brain regions
| Top 10 positively co-expressed genes | ||
| Gene | Pearson's Correlation | Spearman's Correlation |
| ZNF32 | 0.86 | 0.90 |
| DCTN3 | 0.86 | 0.88 |
| UFD1L | 0.86 | 0.90 |
| COQ3 | 0.85 | 0.89 |
| ING4 | 0.85 | 0.89 |
| IAH1 | 0.84 | 0.88 |
| POLB | 0.84 | 0.90 |
| SCNM1 | 0.84 | 0.86 |
| GTF2A2 | 0.84 | 0.87 |
| TSG101 | 0.83 | 0.89 |
| Top 10 negatively co-expressed genes | ||
| Gene | Pearson's Correlation | Spearman's Correlation |
| ZBTB7B | -0.65 | -0.77 |
| EPAS1 | -0.65 | -0.76 |
| SLC6A12 | -0.64 | -0.74 |
| ABCB1 | -0.64 | -0.71 |
| MYH14 | -0.64 | -0.76 |
| AL132868.3 | -0.63 | -0.72 |
| APOL3 | -0.63 | -0.74 |
| AF347015.26 | -0.63 | -0.79 |
| SEMA3G | -0.63 | -0.70 |
| PTRF | -0.62 | -0.71 |
Section V. Pathway annotation
| Pathway name | Pathway size | # SZGR 2.0 genes in pathway | Info |
|---|---|---|---|
| HOLLMANN APOPTOSIS VIA CD40 DN | 267 | 178 | All SZGR 2.0 genes in this pathway |
| ONKEN UVEAL MELANOMA UP | 783 | 507 | All SZGR 2.0 genes in this pathway |
| GRAESSMANN APOPTOSIS BY DOXORUBICIN DN | 1781 | 1082 | All SZGR 2.0 genes in this pathway |
| OUELLET OVARIAN CANCER INVASIVE VS LMP UP | 117 | 85 | All SZGR 2.0 genes in this pathway |
| DACOSTA UV RESPONSE VIA ERCC3 DN | 855 | 609 | All SZGR 2.0 genes in this pathway |
| NUYTTEN EZH2 TARGETS UP | 1037 | 673 | All SZGR 2.0 genes in this pathway |
| STARK HYPPOCAMPUS 22Q11 DELETION UP | 53 | 40 | All SZGR 2.0 genes in this pathway |
| CHEOK RESPONSE TO MERCAPTOPURINE AND LD MTX UP | 10 | 6 | All SZGR 2.0 genes in this pathway |
| FAELT B CLL WITH VH REARRANGEMENTS UP | 48 | 34 | All SZGR 2.0 genes in this pathway |
| LI WILMS TUMOR VS FETAL KIDNEY 1 UP | 182 | 119 | All SZGR 2.0 genes in this pathway |
| SESTO RESPONSE TO UV C4 | 20 | 14 | All SZGR 2.0 genes in this pathway |
| WANG CISPLATIN RESPONSE AND XPC DN | 228 | 146 | All SZGR 2.0 genes in this pathway |
| BAELDE DIABETIC NEPHROPATHY DN | 434 | 302 | All SZGR 2.0 genes in this pathway |
| CREIGHTON ENDOCRINE THERAPY RESISTANCE 5 | 482 | 296 | All SZGR 2.0 genes in this pathway |
| RIGGINS TAMOXIFEN RESISTANCE DN | 220 | 147 | All SZGR 2.0 genes in this pathway |
| MILI PSEUDOPODIA HAPTOTAXIS UP | 518 | 299 | All SZGR 2.0 genes in this pathway |
| BOYAULT LIVER CANCER SUBCLASS G6 UP | 65 | 43 | All SZGR 2.0 genes in this pathway |
| KIM ALL DISORDERS OLIGODENDROCYTE NUMBER CORR UP | 756 | 494 | All SZGR 2.0 genes in this pathway |
| KIM BIPOLAR DISORDER OLIGODENDROCYTE DENSITY CORR UP | 682 | 440 | All SZGR 2.0 genes in this pathway |
| KIM ALL DISORDERS CALB1 CORR UP | 548 | 370 | All SZGR 2.0 genes in this pathway |
| PILON KLF1 TARGETS DN | 1972 | 1213 | All SZGR 2.0 genes in this pathway |
| WAKABAYASHI ADIPOGENESIS PPARG RXRA BOUND 8D | 882 | 506 | All SZGR 2.0 genes in this pathway |
| WAKABAYASHI ADIPOGENESIS PPARG RXRA BOUND WITH H4K20ME1 MARK | 145 | 82 | All SZGR 2.0 genes in this pathway |