Gene Page: PLCL2
Summary ?
| GeneID | 23228 |
| Symbol | PLCL2 |
| Synonyms | PLCE2 |
| Description | phospholipase C like 2 |
| Reference | MIM:614276|HGNC:HGNC:9064|Ensembl:ENSG00000154822|HPRD:07147|Vega:OTTHUMG00000155467 |
| Gene type | protein-coding |
| Map location | 3p24.3 |
| Pascal p-value | 3.052E-4 |
| Sherlock p-value | 0.64 |
| Fetal beta | 0.012 |
| Support | CompositeSet Ascano FMRP targets |
Gene in Data Sources
| Gene set name | Method of gene set | Description | Info |
|---|---|---|---|
| CV:PGCnp | Genome-wide Association Study | GWAS | |
| DNM:Xu_2012 | Whole Exome Sequencing analysis | De novo mutations of 4 genes were identified by exome sequencing of 795 samples in this study | |
| GSMA_I | Genome scan meta-analysis | Psr: 0.006 |
Section I. Genetics and epigenetics annotation
 DNM table
| Gene | Chromosome | Position | Ref | Alt | Transcript | AA change | Mutation type | Sift | CG46 | Trait | Study |
|---|---|---|---|---|---|---|---|---|---|---|---|
| PLCL2 | chr3 | 17051253 | T | A | NM_015184 | p.13C>S | missense | Schizophrenia | DNM:Xu_2012 |
Section II. Transcriptome annotation
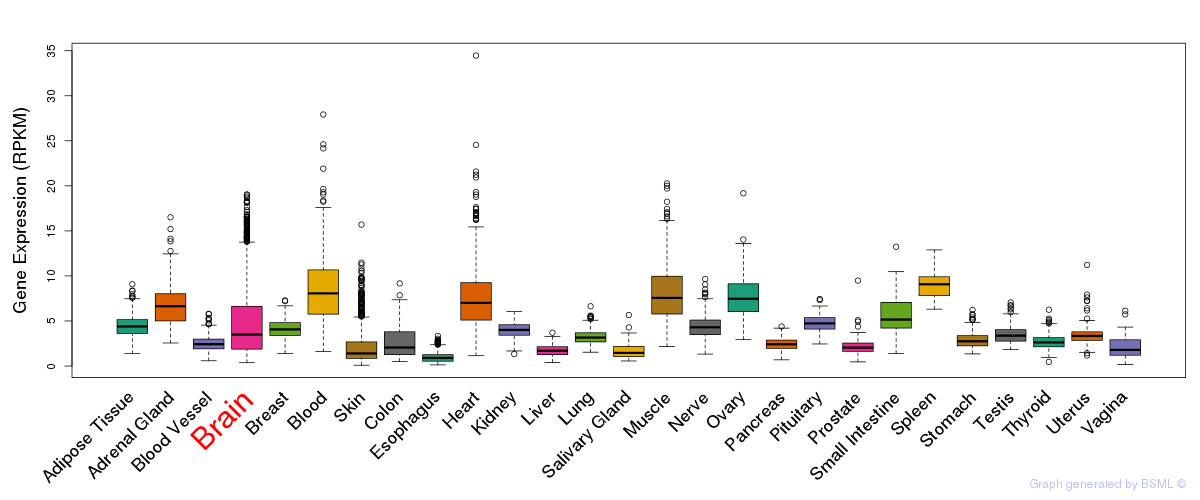
General gene expression (GTEx)
Gene expression during devlopment (BrainCloud)
Footnote:
A total of 269 time points ploted, with n=38 fetal samples (x=1:38). Each triangle represents one time point.
Gene expression of temporal and spatial changes (BrainSpan)
Footnote:
SC: sub-cortical regions; SM: sensory-motor regions; FC: frontal cortex; and TP: temporal-parietal cortex
ST1: fetal (13 - 26 postconception weeks), ST2: early infancy to late childhood (4 months to 11 years), and ST3: adolescence to adulthood (13 - 23 years)
The bar shown representes the lower 25% and upper 25% of the expression distribution.
Top co-expressed genes in brain regions
| Top 10 positively co-expressed genes | ||
| Gene | Pearson's Correlation | Spearman's Correlation |
| DIS3 | 0.95 | 0.95 |
| OSBPL11 | 0.95 | 0.95 |
| GSPT1 | 0.95 | 0.96 |
| VEZT | 0.95 | 0.94 |
| TAF2 | 0.95 | 0.94 |
| WDR48 | 0.95 | 0.95 |
| NUP133 | 0.95 | 0.96 |
| GART | 0.94 | 0.94 |
| WDR3 | 0.94 | 0.94 |
| ZMYM4 | 0.94 | 0.94 |
| Top 10 negatively co-expressed genes | ||
| Gene | Pearson's Correlation | Spearman's Correlation |
| AF347015.31 | -0.79 | -0.87 |
| MT-CO2 | -0.79 | -0.88 |
| AF347015.27 | -0.77 | -0.85 |
| AF347015.8 | -0.76 | -0.87 |
| AF347015.33 | -0.76 | -0.84 |
| MT-CYB | -0.75 | -0.84 |
| IFI27 | -0.74 | -0.84 |
| FXYD1 | -0.74 | -0.84 |
| HLA-F | -0.73 | -0.75 |
| AF347015.15 | -0.73 | -0.84 |
Section III. Gene Ontology annotation
| Molecular function | GO term | Evidence | Neuro keywords | PubMed ID |
|---|---|---|---|---|
| GO:0004871 | signal transducer activity | IEA | - | |
| GO:0005509 | calcium ion binding | IEA | - | |
| GO:0004435 | phosphoinositide phospholipase C activity | IEA | - | |
| Biological process | GO term | Evidence | Neuro keywords | PubMed ID |
| GO:0007242 | intracellular signaling cascade | IEA | - | |
| GO:0006629 | lipid metabolic process | IEA | - | |
| Cellular component | GO term | Evidence | Neuro keywords | PubMed ID |
| GO:0005737 | cytoplasm | IEA | - |
Section V. Pathway annotation
| Pathway name | Pathway size | # SZGR 2.0 genes in pathway | Info |
|---|---|---|---|
| BERTUCCI MEDULLARY VS DUCTAL BREAST CANCER UP | 206 | 111 | All SZGR 2.0 genes in this pathway |
| FULCHER INFLAMMATORY RESPONSE LECTIN VS LPS DN | 463 | 290 | All SZGR 2.0 genes in this pathway |
| ZHOU INFLAMMATORY RESPONSE LIVE DN | 384 | 220 | All SZGR 2.0 genes in this pathway |
| GOZGIT ESR1 TARGETS UP | 149 | 84 | All SZGR 2.0 genes in this pathway |
| FARMER BREAST CANCER APOCRINE VS BASAL | 330 | 217 | All SZGR 2.0 genes in this pathway |
| SCHLOSSER SERUM RESPONSE DN | 712 | 443 | All SZGR 2.0 genes in this pathway |
| PUJANA ATM PCC NETWORK | 1442 | 892 | All SZGR 2.0 genes in this pathway |
| NUYTTEN NIPP1 TARGETS DN | 848 | 527 | All SZGR 2.0 genes in this pathway |
| BUYTAERT PHOTODYNAMIC THERAPY STRESS DN | 637 | 377 | All SZGR 2.0 genes in this pathway |
| FAELT B CLL WITH VH REARRANGEMENTS DN | 48 | 26 | All SZGR 2.0 genes in this pathway |
| FAELT B CLL WITH VH3 21 DN | 49 | 29 | All SZGR 2.0 genes in this pathway |
| BLALOCK ALZHEIMERS DISEASE DN | 1237 | 837 | All SZGR 2.0 genes in this pathway |
| BILD E2F3 ONCOGENIC SIGNATURE | 246 | 153 | All SZGR 2.0 genes in this pathway |
| HELLER HDAC TARGETS SILENCED BY METHYLATION DN | 281 | 179 | All SZGR 2.0 genes in this pathway |
| ACEVEDO LIVER CANCER UP | 973 | 570 | All SZGR 2.0 genes in this pathway |
| SMID BREAST CANCER NORMAL LIKE UP | 476 | 285 | All SZGR 2.0 genes in this pathway |
| QI PLASMACYTOMA UP | 259 | 185 | All SZGR 2.0 genes in this pathway |
| RUTELLA RESPONSE TO CSF2RB AND IL4 DN | 315 | 201 | All SZGR 2.0 genes in this pathway |
| RUTELLA RESPONSE TO HGF DN | 235 | 144 | All SZGR 2.0 genes in this pathway |
| RUTELLA RESPONSE TO HGF VS CSF2RB AND IL4 UP | 408 | 276 | All SZGR 2.0 genes in this pathway |
| STAMBOLSKY RESPONSE TO VITAMIN D3 UP | 84 | 48 | All SZGR 2.0 genes in this pathway |
| PILON KLF1 TARGETS DN | 1972 | 1213 | All SZGR 2.0 genes in this pathway |
| BRUINS UVC RESPONSE VIA TP53 GROUP A | 898 | 516 | All SZGR 2.0 genes in this pathway |
| ACEVEDO FGFR1 TARGETS IN PROSTATE CANCER MODEL UP | 289 | 184 | All SZGR 2.0 genes in this pathway |
| GHANDHI DIRECT IRRADIATION UP | 110 | 68 | All SZGR 2.0 genes in this pathway |
| WARTERS RESPONSE TO IR SKIN | 83 | 44 | All SZGR 2.0 genes in this pathway |
| WARTERS IR RESPONSE 5GY | 47 | 23 | All SZGR 2.0 genes in this pathway |
Section VI. microRNA annotation
| miRNA family | Target position | miRNA ID | miRNA seq | ||
|---|---|---|---|---|---|
| UTR start | UTR end | Match method | |||
| miR-145 | 113 | 120 | 1A,m8 | hsa-miR-145 | GUCCAGUUUUCCCAGGAAUCCCUU |
| miR-181 | 147 | 154 | 1A,m8 | hsa-miR-181abrain | AACAUUCAACGCUGUCGGUGAGU |
| hsa-miR-181bSZ | AACAUUCAUUGCUGUCGGUGGG | ||||
| hsa-miR-181cbrain | AACAUUCAACCUGUCGGUGAGU | ||||
| hsa-miR-181dbrain | AACAUUCAUUGUUGUCGGUGGGUU | ||||
| miR-27 | 143 | 150 | 1A,m8 | hsa-miR-27abrain | UUCACAGUGGCUAAGUUCCGC |
| hsa-miR-27bbrain | UUCACAGUGGCUAAGUUCUGC | ||||
| miR-377 | 169 | 175 | 1A | hsa-miR-377 | AUCACACAAAGGCAACUUUUGU |
| miR-381 | 229 | 235 | 1A | hsa-miR-381 | UAUACAAGGGCAAGCUCUCUGU |
- SZ: miRNAs which differentially expressed in brain cortex of schizophrenia patients comparing with control samples using microarray. Click here to see the list of SZ related miRNAs.
- Brain: miRNAs which are expressed in brain based on miRNA microarray expression studies. Click here to see the list of brain related miRNAs.