Gene Page: FLT3LG
Summary ?
| GeneID | 2323 |
| Symbol | FLT3LG |
| Synonyms | FL|FLT3L |
| Description | fms related tyrosine kinase 3 ligand |
| Reference | MIM:600007|HGNC:HGNC:3766|Ensembl:ENSG00000090554|HPRD:02477|Vega:OTTHUMG00000186490 |
| Gene type | protein-coding |
| Map location | 19q13.3 |
| Pascal p-value | 2.655E-4 |
| Fetal beta | -0.088 |
| DMG | 1 (# studies) |
Gene in Data Sources
| Gene set name | Method of gene set | Description | Info |
|---|---|---|---|
| CV:PGCnp | Genome-wide Association Study | GWAS | |
| DMG:vanEijk_2014 | Genome-wide DNA methylation analysis | This dataset includes 432 differentially methylated CpG sites corresponding to 391 unique transcripts between schizophrenia patients (n=260) and unaffected controls (n=250). | 1 |
Section I. Genetics and epigenetics annotation
 Differentially methylated gene
| Probe | Chromosome | Position | Nearest gene | P (dis) | Beta (dis) | FDR (dis) | Study |
|---|---|---|---|---|---|---|---|
| cg15528736 | 19 | 50015780 | FLT3LG | 3.06E-5 | 6.562 | DMG:vanEijk_2014 |
Section II. Transcriptome annotation
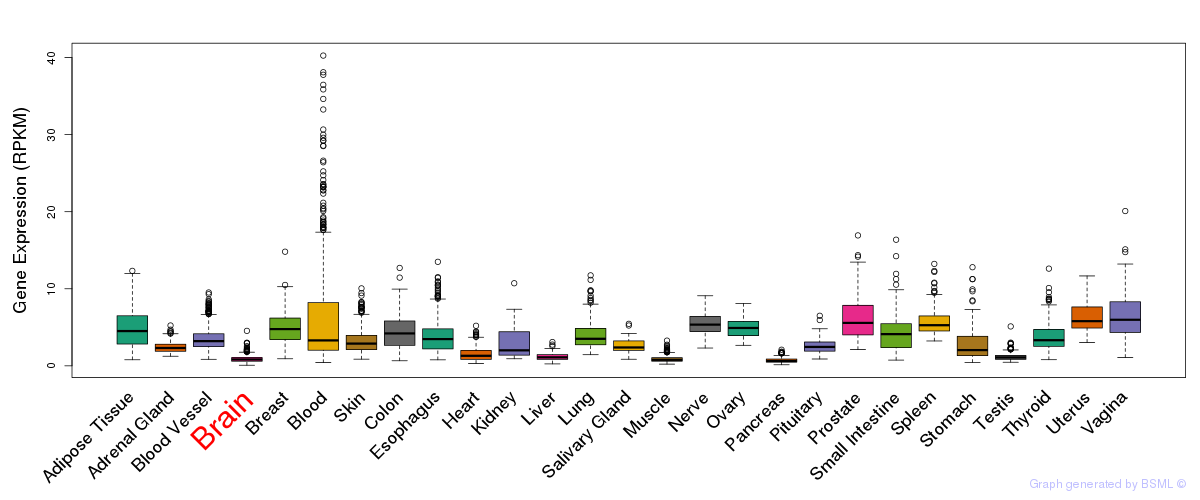
General gene expression (GTEx)
Gene expression during devlopment (BrainCloud)
Footnote:
A total of 269 time points ploted, with n=38 fetal samples (x=1:38). Each triangle represents one time point.
Gene expression of temporal and spatial changes (BrainSpan)
Footnote:
SC: sub-cortical regions; SM: sensory-motor regions; FC: frontal cortex; and TP: temporal-parietal cortex
ST1: fetal (13 - 26 postconception weeks), ST2: early infancy to late childhood (4 months to 11 years), and ST3: adolescence to adulthood (13 - 23 years)
The bar shown representes the lower 25% and upper 25% of the expression distribution.
Top co-expressed genes in brain regions
| Top 10 positively co-expressed genes | ||
| Gene | Pearson's Correlation | Spearman's Correlation |
| KIAA0391 | 0.86 | 0.83 |
| SNX6 | 0.85 | 0.87 |
| ATG3 | 0.83 | 0.81 |
| ASCC1 | 0.81 | 0.79 |
| PTGES3 | 0.81 | 0.77 |
| DRG1 | 0.81 | 0.77 |
| UBA3 | 0.81 | 0.77 |
| DNAJC8 | 0.80 | 0.74 |
| COPS2 | 0.80 | 0.76 |
| GPN3 | 0.80 | 0.79 |
| Top 10 negatively co-expressed genes | ||
| Gene | Pearson's Correlation | Spearman's Correlation |
| MT-CO2 | -0.56 | -0.54 |
| MT-CYB | -0.56 | -0.56 |
| AF347015.2 | -0.55 | -0.56 |
| AF347015.8 | -0.55 | -0.54 |
| AF347015.15 | -0.53 | -0.56 |
| AF347015.31 | -0.52 | -0.54 |
| AF347015.33 | -0.52 | -0.54 |
| AF347015.21 | -0.51 | -0.48 |
| AF347015.27 | -0.51 | -0.51 |
| AF347015.26 | -0.50 | -0.53 |
Section V. Pathway annotation
| Pathway name | Pathway size | # SZGR 2.0 genes in pathway | Info |
|---|---|---|---|
| KEGG CYTOKINE CYTOKINE RECEPTOR INTERACTION | 267 | 161 | All SZGR 2.0 genes in this pathway |
| KEGG HEMATOPOIETIC CELL LINEAGE | 88 | 60 | All SZGR 2.0 genes in this pathway |
| KEGG PATHWAYS IN CANCER | 328 | 259 | All SZGR 2.0 genes in this pathway |
| GRAESSMANN APOPTOSIS BY SERUM DEPRIVATION DN | 234 | 147 | All SZGR 2.0 genes in this pathway |
| GRUETZMANN PANCREATIC CANCER DN | 203 | 134 | All SZGR 2.0 genes in this pathway |
| JAZAG TGFB1 SIGNALING VIA SMAD4 DN | 66 | 38 | All SZGR 2.0 genes in this pathway |
| WANG RESPONSE TO BEXAROTENE DN | 29 | 19 | All SZGR 2.0 genes in this pathway |
| KONDO HYPOXIA | 8 | 6 | All SZGR 2.0 genes in this pathway |
| POMEROY MEDULLOBLASTOMA DESMOPLASIC VS CLASSIC UP | 62 | 38 | All SZGR 2.0 genes in this pathway |
| FLECHNER PBL KIDNEY TRANSPLANT OK VS DONOR UP | 151 | 100 | All SZGR 2.0 genes in this pathway |
| SANSOM APC TARGETS DN | 366 | 238 | All SZGR 2.0 genes in this pathway |
| PARK HSC MARKERS | 44 | 31 | All SZGR 2.0 genes in this pathway |
| MUNSHI MULTIPLE MYELOMA UP | 81 | 52 | All SZGR 2.0 genes in this pathway |
| BROWNE HCMV INFECTION 48HR DN | 504 | 323 | All SZGR 2.0 genes in this pathway |
| RODWELL AGING KIDNEY UP | 487 | 303 | All SZGR 2.0 genes in this pathway |
| SMID BREAST CANCER NORMAL LIKE UP | 476 | 285 | All SZGR 2.0 genes in this pathway |
| GREGORY SYNTHETIC LETHAL WITH IMATINIB | 145 | 83 | All SZGR 2.0 genes in this pathway |
| BOSCO ALLERGEN INDUCED TH2 ASSOCIATED MODULE | 151 | 86 | All SZGR 2.0 genes in this pathway |
| NABA SECRETED FACTORS | 344 | 197 | All SZGR 2.0 genes in this pathway |
| NABA MATRISOME ASSOCIATED | 753 | 411 | All SZGR 2.0 genes in this pathway |
| NABA MATRISOME | 1028 | 559 | All SZGR 2.0 genes in this pathway |