Gene Page: MCF2L
Summary ?
| GeneID | 23263 |
| Symbol | MCF2L |
| Synonyms | ARHGEF14|DBS|OST |
| Description | MCF.2 cell line derived transforming sequence like |
| Reference | MIM:609499|HGNC:HGNC:14576|Ensembl:ENSG00000126217|HPRD:14371|Vega:OTTHUMG00000017377 |
| Gene type | protein-coding |
| Map location | 13q34 |
| Pascal p-value | 0.363 |
| DEG p-value | DEG:Maycox_2009:CC_BA10_fold_change=1.23:CC_BA10_disease_P=0.0416:HBB_BA9_fold_change=1.22:HBB_BA9_disease_P=0.0309 |
| DMG | 1 (# studies) |
| eGene | Cerebellar Hemisphere Cerebellum Hippocampus Putamen basal ganglia |
Gene in Data Sources
| Gene set name | Method of gene set | Description | Info |
|---|---|---|---|
| CV:PGCnp | Genome-wide Association Study | GWAS | |
| DEG:Maycox_2009 | Microarray to determine the expression of over 30000 mRNA transcripts in post-mortem tissue | We included 51 genes whose expression changes are common between two schizophrenia cohorts. | |
| DMG:Wockner_2014 | Genome-wide DNA methylation analysis | This dataset includes 4641 differentially methylated probes corresponding to 2929 unique genes between schizophrenia patients (n=24) and controls (n=24). | 4 |
Section I. Genetics and epigenetics annotation
 Differentially methylated gene
| Probe | Chromosome | Position | Nearest gene | P (dis) | Beta (dis) | FDR (dis) | Study |
|---|---|---|---|---|---|---|---|
| cg16564828 | 13 | 113660298 | MCF2L | 2.46E-6 | 0.769 | 0.008 | DMG:Wockner_2014 |
| cg19028462 | 13 | 113677628 | MCF2L | 2.7E-5 | -0.821 | 0.018 | DMG:Wockner_2014 |
| cg04024481 | 13 | 113752435 | MCF2L | 5.94E-5 | 0.391 | 0.023 | DMG:Wockner_2014 |
| cg26682407 | 13 | 113660246 | MCF2L | 1.51E-4 | 0.564 | 0.032 | DMG:Wockner_2014 |
eQTL annotation
| SNP ID | Chromosome | Position | eGene | Gene Entrez ID | pvalue | qvalue | TSS distance | eQTL type |
|---|---|---|---|---|---|---|---|---|
| rs3011518 | 13 | 113676258 | MCF2L | ENSG00000126217.16 | 2.648E-8 | 0 | 127566 | gtex_brain_putamen_basal |
| rs3011517 | 13 | 113676795 | MCF2L | ENSG00000126217.16 | 1.556E-8 | 0 | 128103 | gtex_brain_putamen_basal |
| rs3011516 | 13 | 113676801 | MCF2L | ENSG00000126217.16 | 1.549E-8 | 0 | 128109 | gtex_brain_putamen_basal |
| rs2993304 | 13 | 113677170 | MCF2L | ENSG00000126217.16 | 1.305E-8 | 0 | 128478 | gtex_brain_putamen_basal |
| rs2993307 | 13 | 113680999 | MCF2L | ENSG00000126217.16 | 2.13E-8 | 0 | 132307 | gtex_brain_putamen_basal |
| rs2993309 | 13 | 113682246 | MCF2L | ENSG00000126217.16 | 6.883E-10 | 0 | 133554 | gtex_brain_putamen_basal |
| rs2993310 | 13 | 113682788 | MCF2L | ENSG00000126217.16 | 7.509E-10 | 0 | 134096 | gtex_brain_putamen_basal |
| rs2993311 | 13 | 113683045 | MCF2L | ENSG00000126217.16 | 2.872E-7 | 0 | 134353 | gtex_brain_putamen_basal |
| rs2993313 | 13 | 113684467 | MCF2L | ENSG00000126217.16 | 2.582E-9 | 0 | 135775 | gtex_brain_putamen_basal |
| rs2993314 | 13 | 113685128 | MCF2L | ENSG00000126217.16 | 2.781E-8 | 0 | 136436 | gtex_brain_putamen_basal |
| rs67050717 | 13 | 113685550 | MCF2L | ENSG00000126217.16 | 8.797E-9 | 0 | 136858 | gtex_brain_putamen_basal |
| rs2993315 | 13 | 113685654 | MCF2L | ENSG00000126217.16 | 2.662E-8 | 0 | 136962 | gtex_brain_putamen_basal |
| rs3011510 | 13 | 113686025 | MCF2L | ENSG00000126217.16 | 8.827E-8 | 0 | 137333 | gtex_brain_putamen_basal |
| rs3011509 | 13 | 113686209 | MCF2L | ENSG00000126217.16 | 2.761E-8 | 0 | 137517 | gtex_brain_putamen_basal |
| rs2993317 | 13 | 113687143 | MCF2L | ENSG00000126217.16 | 2.796E-8 | 0 | 138451 | gtex_brain_putamen_basal |
| rs2993319 | 13 | 113687405 | MCF2L | ENSG00000126217.16 | 6.298E-8 | 0 | 138713 | gtex_brain_putamen_basal |
| rs2993321 | 13 | 113687950 | MCF2L | ENSG00000126217.16 | 2.761E-8 | 0 | 139258 | gtex_brain_putamen_basal |
| rs3011506 | 13 | 113688269 | MCF2L | ENSG00000126217.16 | 2.761E-8 | 0 | 139577 | gtex_brain_putamen_basal |
| rs2993322 | 13 | 113688711 | MCF2L | ENSG00000126217.16 | 2.936E-8 | 0 | 140019 | gtex_brain_putamen_basal |
| rs28464357 | 13 | 113688862 | MCF2L | ENSG00000126217.16 | 2.744E-8 | 0 | 140170 | gtex_brain_putamen_basal |
| rs3011505 | 13 | 113691083 | MCF2L | ENSG00000126217.16 | 2.476E-9 | 0 | 142391 | gtex_brain_putamen_basal |
| rs4907576 | 13 | 113692063 | MCF2L | ENSG00000126217.16 | 1.497E-9 | 0 | 143371 | gtex_brain_putamen_basal |
| rs1537024 | 13 | 113696472 | MCF2L | ENSG00000126217.16 | 6.934E-9 | 0 | 147780 | gtex_brain_putamen_basal |
| rs7984552 | 13 | 113697854 | MCF2L | ENSG00000126217.16 | 6.291E-11 | 0 | 149162 | gtex_brain_putamen_basal |
| rs7330238 | 13 | 113703404 | MCF2L | ENSG00000126217.16 | 4.471E-9 | 0 | 154712 | gtex_brain_putamen_basal |
| . | 13 | 113704590 | MCF2L | ENSG00000126217.16 | 2.024E-9 | 0 | 155898 | gtex_brain_putamen_basal |
| rs373809009 | 13 | 113705588 | MCF2L | ENSG00000126217.16 | 5.631E-7 | 0 | 156896 | gtex_brain_putamen_basal |
| rs4907579 | 13 | 113706415 | MCF2L | ENSG00000126217.16 | 4.781E-11 | 0 | 157723 | gtex_brain_putamen_basal |
| rs7337434 | 13 | 113707867 | MCF2L | ENSG00000126217.16 | 5.951E-11 | 0 | 159175 | gtex_brain_putamen_basal |
| rs7328336 | 13 | 113712706 | MCF2L | ENSG00000126217.16 | 5.865E-11 | 0 | 164014 | gtex_brain_putamen_basal |
| rs28589473 | 13 | 113713101 | MCF2L | ENSG00000126217.16 | 2.359E-8 | 0 | 164409 | gtex_brain_putamen_basal |
| rs6577026 | 13 | 113713671 | MCF2L | ENSG00000126217.16 | 2.345E-8 | 0 | 164979 | gtex_brain_putamen_basal |
| rs4907581 | 13 | 113713905 | MCF2L | ENSG00000126217.16 | 2.37E-8 | 0 | 165213 | gtex_brain_putamen_basal |
| rs9549650 | 13 | 113715787 | MCF2L | ENSG00000126217.16 | 7.995E-12 | 0 | 167095 | gtex_brain_putamen_basal |
Section II. Transcriptome annotation
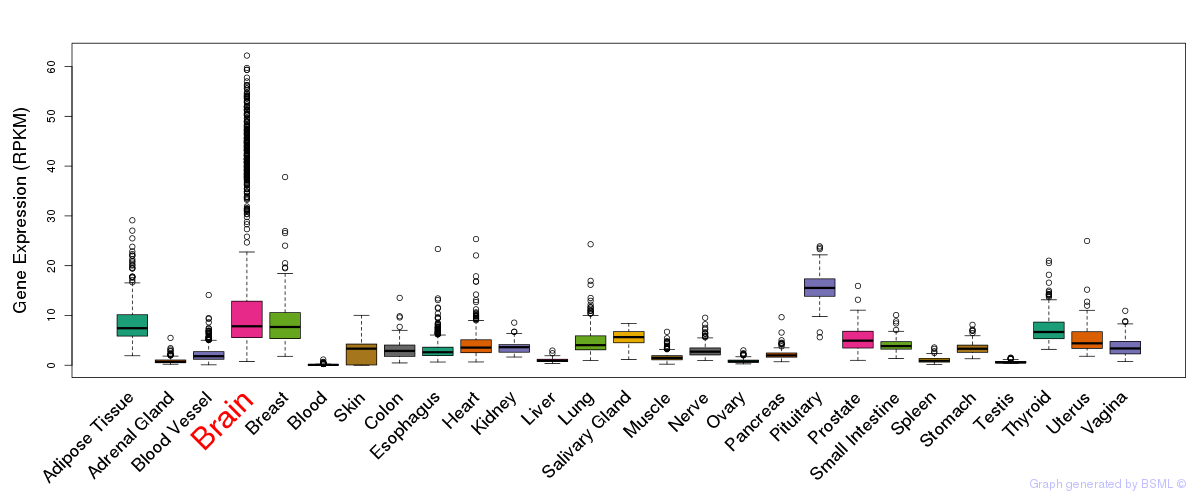
General gene expression (GTEx)
Gene expression during devlopment (BrainCloud)
Footnote:
A total of 269 time points ploted, with n=38 fetal samples (x=1:38). Each triangle represents one time point.
Gene expression of temporal and spatial changes (BrainSpan)
Footnote:
SC: sub-cortical regions; SM: sensory-motor regions; FC: frontal cortex; and TP: temporal-parietal cortex
ST1: fetal (13 - 26 postconception weeks), ST2: early infancy to late childhood (4 months to 11 years), and ST3: adolescence to adulthood (13 - 23 years)
The bar shown representes the lower 25% and upper 25% of the expression distribution.
Top co-expressed genes in brain regions
| Top 10 positively co-expressed genes | ||
| Gene | Pearson's Correlation | Spearman's Correlation |
| KIAA0317 | 0.88 | 0.91 |
| KIF3C | 0.88 | 0.92 |
| C6orf168 | 0.87 | 0.90 |
| PNMA1 | 0.87 | 0.90 |
| SH3BP5L | 0.87 | 0.91 |
| SLC8A3 | 0.87 | 0.90 |
| KLHL18 | 0.87 | 0.91 |
| MAPT | 0.87 | 0.93 |
| PCDHAC1 | 0.86 | 0.91 |
| MSL1 | 0.86 | 0.89 |
| Top 10 negatively co-expressed genes | ||
| Gene | Pearson's Correlation | Spearman's Correlation |
| AF347015.31 | -0.76 | -0.80 |
| MT-CO2 | -0.75 | -0.80 |
| AF347015.33 | -0.74 | -0.77 |
| FXYD1 | -0.74 | -0.77 |
| AC021016.1 | -0.73 | -0.81 |
| AF347015.27 | -0.73 | -0.78 |
| MT-CYB | -0.73 | -0.78 |
| AF347015.8 | -0.72 | -0.79 |
| COPZ2 | -0.71 | -0.76 |
| S100B | -0.70 | -0.75 |
Section V. Pathway annotation
| Pathway name | Pathway size | # SZGR 2.0 genes in pathway | Info |
|---|---|---|---|
| PID RHOA REG PATHWAY | 46 | 30 | All SZGR 2.0 genes in this pathway |
| PID CDC42 REG PATHWAY | 30 | 22 | All SZGR 2.0 genes in this pathway |
| PID TRKR PATHWAY | 62 | 48 | All SZGR 2.0 genes in this pathway |
| CHARAFE BREAST CANCER LUMINAL VS MESENCHYMAL UP | 450 | 256 | All SZGR 2.0 genes in this pathway |
| VECCHI GASTRIC CANCER EARLY UP | 430 | 232 | All SZGR 2.0 genes in this pathway |
| MULLIGHAN MLL SIGNATURE 1 DN | 242 | 165 | All SZGR 2.0 genes in this pathway |
| MULLIGHAN MLL SIGNATURE 2 DN | 281 | 186 | All SZGR 2.0 genes in this pathway |
| ZHOU INFLAMMATORY RESPONSE FIMA UP | 544 | 308 | All SZGR 2.0 genes in this pathway |
| ZHOU INFLAMMATORY RESPONSE LPS UP | 431 | 237 | All SZGR 2.0 genes in this pathway |
| DODD NASOPHARYNGEAL CARCINOMA UP | 1821 | 933 | All SZGR 2.0 genes in this pathway |
| PEREZ TP53 TARGETS | 1174 | 695 | All SZGR 2.0 genes in this pathway |
| FARMER BREAST CANCER APOCRINE VS LUMINAL | 326 | 213 | All SZGR 2.0 genes in this pathway |
| TAGHAVI NEOPLASTIC TRANSFORMATION | 12 | 10 | All SZGR 2.0 genes in this pathway |
| AMIT EGF RESPONSE 120 HELA | 69 | 47 | All SZGR 2.0 genes in this pathway |
| XU GH1 AUTOCRINE TARGETS DN | 142 | 94 | All SZGR 2.0 genes in this pathway |
| FOSTER TOLERANT MACROPHAGE DN | 409 | 268 | All SZGR 2.0 genes in this pathway |
| MITSIADES RESPONSE TO APLIDIN UP | 439 | 257 | All SZGR 2.0 genes in this pathway |
| SMID BREAST CANCER BASAL DN | 701 | 446 | All SZGR 2.0 genes in this pathway |
| GRADE COLON CANCER UP | 871 | 505 | All SZGR 2.0 genes in this pathway |
| BOQUEST STEM CELL DN | 216 | 143 | All SZGR 2.0 genes in this pathway |
| YOSHIMURA MAPK8 TARGETS UP | 1305 | 895 | All SZGR 2.0 genes in this pathway |
| JISON SICKLE CELL DISEASE DN | 181 | 97 | All SZGR 2.0 genes in this pathway |
| MIKKELSEN MEF HCP WITH H3K27ME3 | 590 | 403 | All SZGR 2.0 genes in this pathway |
| SENGUPTA EBNA1 ANTICORRELATED | 173 | 85 | All SZGR 2.0 genes in this pathway |
| KIM ALL DISORDERS OLIGODENDROCYTE NUMBER CORR UP | 756 | 494 | All SZGR 2.0 genes in this pathway |
| PANGAS TUMOR SUPPRESSION BY SMAD1 AND SMAD5 UP | 134 | 85 | All SZGR 2.0 genes in this pathway |
| BRUINS UVC RESPONSE VIA TP53 GROUP A | 898 | 516 | All SZGR 2.0 genes in this pathway |
| PLASARI TGFB1 SIGNALING VIA NFIC 10HR DN | 30 | 25 | All SZGR 2.0 genes in this pathway |
| FORTSCHEGGER PHF8 TARGETS UP | 279 | 155 | All SZGR 2.0 genes in this pathway |
| ZWANG TRANSIENTLY UP BY 2ND EGF PULSE ONLY | 1725 | 838 | All SZGR 2.0 genes in this pathway |