Gene Page: ACSL6
Summary ?
| GeneID | 23305 |
| Symbol | ACSL6 |
| Synonyms | ACS2|FACL6|LACS 6|LACS2|LACS5 |
| Description | acyl-CoA synthetase long-chain family member 6 |
| Reference | MIM:604443|HGNC:HGNC:16496|Ensembl:ENSG00000164398|HPRD:09190|Vega:OTTHUMG00000150692 |
| Gene type | protein-coding |
| Map location | 5q31.1 |
| Pascal p-value | 0.121 |
| Fetal beta | -0.719 |
| eGene | Cerebellar Hemisphere Cortex Nucleus accumbens basal ganglia Meta |
| Support | G2Cdb.human_BAYES-COLLINS-HUMAN-PSD-CONSENSUS G2Cdb.human_BAYES-COLLINS-HUMAN-PSD-FULL G2Cdb.human_BAYES-COLLINS-MOUSE-PSD-CONSENSUS G2Cdb.humanPSD G2Cdb.humanPSP CompositeSet |
Gene in Data Sources
| Gene set name | Method of gene set | Description | Info |
|---|---|---|---|
| CV:GWASdb | Genome-wide Association Studies | GWASdb records for schizophrenia | |
| CV:PGCnp | Genome-wide Association Study | GWAS | |
| PMID:cooccur | High-throughput literature-search | Systematic search in PubMed for genes co-occurring with SCZ keywords. A total of 3027 genes were included. | |
| Association | A combined odds ratio method (Sun et al. 2008), association studies | 2 | Link to SZGene |
| GSMA_I | Genome scan meta-analysis | Psr: 0.0032 | |
| Literature | High-throughput literature-search | Co-occurance with Schizophrenia keywords: schizophrenia,schizophrenic,schizophrenias | Click to show details |
Section I. Genetics and epigenetics annotation
Section II. Transcriptome annotation
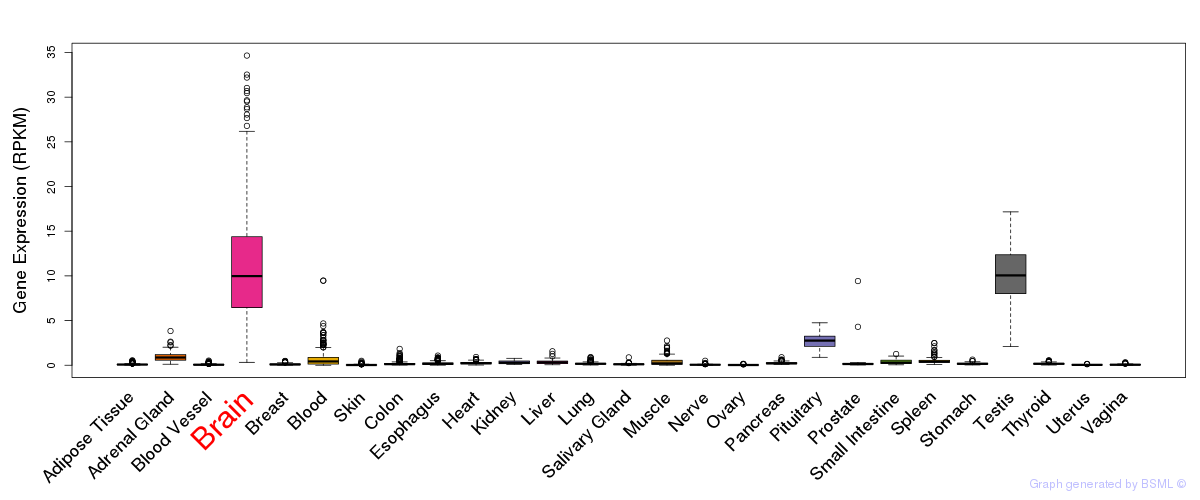
General gene expression (GTEx)
Gene expression during devlopment (BrainCloud)
Footnote:
A total of 269 time points ploted, with n=38 fetal samples (x=1:38). Each triangle represents one time point.
Gene expression of temporal and spatial changes (BrainSpan)
Footnote:
SC: sub-cortical regions; SM: sensory-motor regions; FC: frontal cortex; and TP: temporal-parietal cortex
ST1: fetal (13 - 26 postconception weeks), ST2: early infancy to late childhood (4 months to 11 years), and ST3: adolescence to adulthood (13 - 23 years)
The bar shown representes the lower 25% and upper 25% of the expression distribution.
Top co-expressed genes in brain regions
| Top 10 positively co-expressed genes | ||
| Gene | Pearson's Correlation | Spearman's Correlation |
| PDE1B | 0.95 | 0.91 |
| AC005512.1 | 0.95 | 0.67 |
| ADORA2A | 0.93 | 0.05 |
| WNT6 | 0.92 | 0.56 |
| LINGO3 | 0.92 | 0.77 |
| TMEM90A | 0.90 | 0.61 |
| RGS9 | 0.90 | 0.24 |
| PENK | 0.90 | 0.43 |
| PTPN7 | 0.89 | 0.21 |
| RGS14 | 0.89 | 0.74 |
| Top 10 negatively co-expressed genes | ||
| Gene | Pearson's Correlation | Spearman's Correlation |
| ZNF435 | -0.22 | -0.30 |
| TUBB2B | -0.22 | -0.42 |
| STMN1 | -0.22 | -0.13 |
| KIAA1949 | -0.22 | -0.30 |
| CBS | -0.21 | -0.29 |
| BLVRA | -0.21 | -0.10 |
| CCDC90A | -0.21 | -0.27 |
| IGFBP2 | -0.21 | -0.31 |
| RPL38 | -0.21 | -0.60 |
| DYNLT1 | -0.21 | -0.51 |
Section III. Gene Ontology annotation
| Molecular function | GO term | Evidence | Neuro keywords | PubMed ID |
|---|---|---|---|---|
| GO:0000287 | magnesium ion binding | IEA | - | |
| GO:0003824 | catalytic activity | IEA | - | |
| GO:0004467 | long-chain-fatty-acid-CoA ligase activity | NAS | 10548543 | |
| GO:0016874 | ligase activity | IEA | - | |
| Biological process | GO term | Evidence | Neuro keywords | PubMed ID |
| GO:0008152 | metabolic process | IEA | - | |
| GO:0006637 | acyl-CoA metabolic process | NAS | 10548543 | |
| GO:0006629 | lipid metabolic process | IEA | - | |
| Cellular component | GO term | Evidence | Neuro keywords | PubMed ID |
| GO:0005792 | microsome | NAS | - | |
| GO:0005789 | endoplasmic reticulum membrane | IEA | - | |
| GO:0005739 | mitochondrion | IEA | - | |
| GO:0005741 | mitochondrial outer membrane | NAS | - | |
| GO:0005777 | peroxisome | IEA | - | |
| GO:0005778 | peroxisomal membrane | NAS | - | |
| GO:0005783 | endoplasmic reticulum | IEA | - | |
| GO:0016021 | integral to membrane | IEA | - | |
| GO:0005886 | plasma membrane | NAS | 10548543 |
Section V. Pathway annotation
| Pathway name | Pathway size | # SZGR 2.0 genes in pathway | Info |
|---|---|---|---|
| KEGG FATTY ACID METABOLISM | 42 | 29 | All SZGR 2.0 genes in this pathway |
| KEGG PPAR SIGNALING PATHWAY | 69 | 47 | All SZGR 2.0 genes in this pathway |
| KEGG PEROXISOME | 78 | 47 | All SZGR 2.0 genes in this pathway |
| KEGG ADIPOCYTOKINE SIGNALING PATHWAY | 67 | 57 | All SZGR 2.0 genes in this pathway |
| REACTOME TRIGLYCERIDE BIOSYNTHESIS | 38 | 26 | All SZGR 2.0 genes in this pathway |
| REACTOME FATTY ACYL COA BIOSYNTHESIS | 18 | 15 | All SZGR 2.0 genes in this pathway |
| REACTOME METABOLISM OF LIPIDS AND LIPOPROTEINS | 478 | 302 | All SZGR 2.0 genes in this pathway |
| REACTOME FATTY ACID TRIACYLGLYCEROL AND KETONE BODY METABOLISM | 168 | 115 | All SZGR 2.0 genes in this pathway |
| REACTOME SYNTHESIS OF VERY LONG CHAIN FATTY ACYL COAS | 14 | 12 | All SZGR 2.0 genes in this pathway |
| WATANABE COLON CANCER MSI VS MSS DN | 81 | 42 | All SZGR 2.0 genes in this pathway |
| DEURIG T CELL PROLYMPHOCYTIC LEUKEMIA UP | 368 | 234 | All SZGR 2.0 genes in this pathway |
| OSWALD HEMATOPOIETIC STEM CELL IN COLLAGEN GEL UP | 233 | 161 | All SZGR 2.0 genes in this pathway |
| TAKEDA TARGETS OF NUP98 HOXA9 FUSION 10D DN | 142 | 90 | All SZGR 2.0 genes in this pathway |
| SABATES COLORECTAL ADENOMA UP | 141 | 75 | All SZGR 2.0 genes in this pathway |
| JAATINEN HEMATOPOIETIC STEM CELL DN | 226 | 132 | All SZGR 2.0 genes in this pathway |
| MYLLYKANGAS AMPLIFICATION HOT SPOT 27 | 15 | 8 | All SZGR 2.0 genes in this pathway |
| MOREAUX MULTIPLE MYELOMA BY TACI UP | 412 | 249 | All SZGR 2.0 genes in this pathway |
| GRESHOCK CANCER COPY NUMBER UP | 323 | 240 | All SZGR 2.0 genes in this pathway |
| MOOTHA HUMAN MITODB 6 2002 | 429 | 260 | All SZGR 2.0 genes in this pathway |
| LEE LIVER CANCER SURVIVAL UP | 185 | 112 | All SZGR 2.0 genes in this pathway |
| BOYAULT LIVER CANCER SUBCLASS G6 UP | 65 | 43 | All SZGR 2.0 genes in this pathway |
| CHIANG LIVER CANCER SUBCLASS CTNNB1 UP | 176 | 110 | All SZGR 2.0 genes in this pathway |
| YAGI AML WITH INV 16 TRANSLOCATION | 422 | 277 | All SZGR 2.0 genes in this pathway |
| MIKKELSEN MEF HCP WITH H3K27ME3 | 590 | 403 | All SZGR 2.0 genes in this pathway |
| TERAO AOX4 TARGETS HG UP | 28 | 20 | All SZGR 2.0 genes in this pathway |
| TERAO AOX4 TARGETS SKIN DN | 27 | 15 | All SZGR 2.0 genes in this pathway |
| RATTENBACHER BOUND BY CELF1 | 467 | 251 | All SZGR 2.0 genes in this pathway |
Section VI. microRNA annotation
| miRNA family | Target position | miRNA ID | miRNA seq | ||
|---|---|---|---|---|---|
| UTR start | UTR end | Match method | |||
| let-7/98 | 400 | 407 | 1A,m8 | hsa-let-7abrain | UGAGGUAGUAGGUUGUAUAGUU |
| hsa-let-7bbrain | UGAGGUAGUAGGUUGUGUGGUU | ||||
| hsa-let-7cbrain | UGAGGUAGUAGGUUGUAUGGUU | ||||
| hsa-let-7dbrain | AGAGGUAGUAGGUUGCAUAGU | ||||
| hsa-let-7ebrain | UGAGGUAGGAGGUUGUAUAGU | ||||
| hsa-let-7fbrain | UGAGGUAGUAGAUUGUAUAGUU | ||||
| hsa-miR-98brain | UGAGGUAGUAAGUUGUAUUGUU | ||||
| hsa-let-7gSZ | UGAGGUAGUAGUUUGUACAGU | ||||
| hsa-let-7ibrain | UGAGGUAGUAGUUUGUGCUGU | ||||
| miR-137 | 39 | 45 | 1A | hsa-miR-137 | UAUUGCUUAAGAAUACGCGUAG |
| miR-196 | 399 | 405 | m8 | hsa-miR-196a | UAGGUAGUUUCAUGUUGUUGG |
| hsa-miR-196b | UAGGUAGUUUCCUGUUGUUGG | ||||
| miR-24* | 387 | 393 | 1A | hsa-miR-189 | GUGCCUACUGAGCUGAUAUCAGU |
| miR-496 | 236 | 242 | 1A | hsa-miR-496 | AUUACAUGGCCAAUCUC |
- SZ: miRNAs which differentially expressed in brain cortex of schizophrenia patients comparing with control samples using microarray. Click here to see the list of SZ related miRNAs.
- Brain: miRNAs which are expressed in brain based on miRNA microarray expression studies. Click here to see the list of brain related miRNAs.