Gene Page: SATB2
Summary ?
| GeneID | 23314 |
| Symbol | SATB2 |
| Synonyms | GLSS |
| Description | SATB homeobox 2 |
| Reference | MIM:608148|HGNC:HGNC:21637|Ensembl:ENSG00000119042|HPRD:12178|Vega:OTTHUMG00000132767 |
| Gene type | protein-coding |
| Map location | 2q33 |
| Pascal p-value | 2.328E-7 |
| Sherlock p-value | 0.972 |
| Fetal beta | 2.063 |
| DMG | 1 (# studies) |
| eGene | Hippocampus |
| Support | Chromatin Remodeling Genes |
Gene in Data Sources
| Gene set name | Method of gene set | Description | Info |
|---|---|---|---|
| CV:GWAScat | Genome-wide Association Studies | This data set includes 560 SNPs associated with schizophrenia. A total of 486 genes were mapped to these SNPs within 50kb. | |
| CV:GWASdb | Genome-wide Association Studies | GWASdb records for schizophrenia | |
| CV:PGC128 | Genome-wide Association Study | A multi-stage schizophrenia GWAS of up to 36,989 cases and 113,075 controls. Reported by the Schizophrenia Working Group of PGC. 128 independent associations spanning 108 loci | |
| CV:PGCnp | Genome-wide Association Study | GWAS | |
| DMG:Wockner_2014 | Genome-wide DNA methylation analysis | This dataset includes 4641 differentially methylated probes corresponding to 2929 unique genes between schizophrenia patients (n=24) and controls (n=24). | 1 |
| PMID:cooccur | High-throughput literature-search | Systematic search in PubMed for genes co-occurring with SCZ keywords. A total of 3027 genes were included. | |
| Literature | High-throughput literature-search | Co-occurance with Schizophrenia keywords: schizophrenia,schizophrenias | Click to show details |
Section I. Genetics and epigenetics annotation
 CV:PGC128
| SNP ID | Chromosome | Position | Allele | P | Function | Gene | Up/Down Distance |
|---|---|---|---|---|---|---|---|
| rs6704641 | chr2 | 200164252 | AG | 3.397E-8 | intronic | SATB2 |
Differentially methylated gene
| Probe | Chromosome | Position | Nearest gene | P (dis) | Beta (dis) | FDR (dis) | Study |
|---|---|---|---|---|---|---|---|
| cg08779779 | 2 | 200322566 | SATB2 | 2.805E-4 | -0.194 | 0.039 | DMG:Wockner_2014 |
Section II. Transcriptome annotation
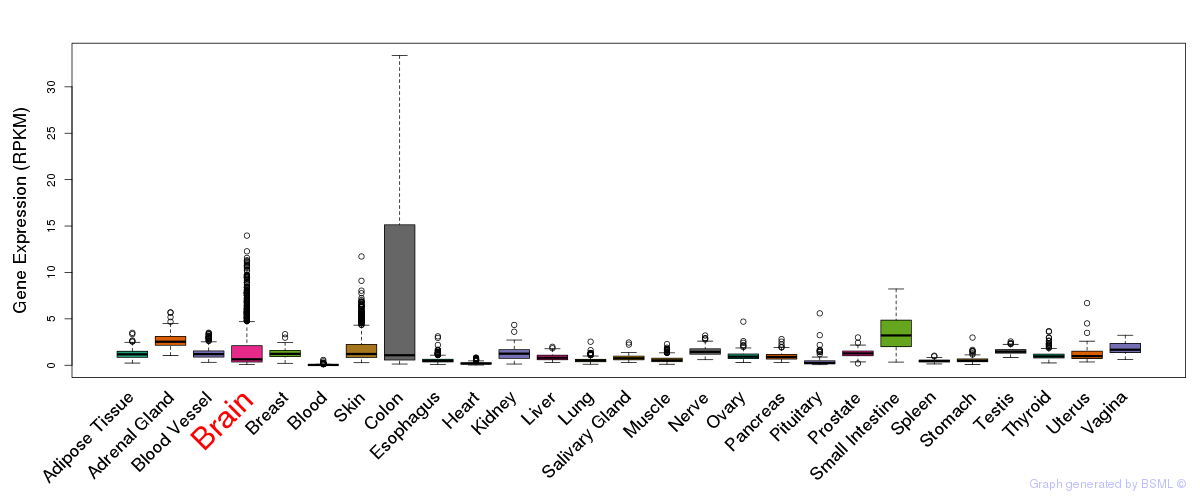
General gene expression (GTEx)
Gene expression during devlopment (BrainCloud)
Footnote:
A total of 269 time points ploted, with n=38 fetal samples (x=1:38). Each triangle represents one time point.
Gene expression of temporal and spatial changes (BrainSpan)
Footnote:
SC: sub-cortical regions; SM: sensory-motor regions; FC: frontal cortex; and TP: temporal-parietal cortex
ST1: fetal (13 - 26 postconception weeks), ST2: early infancy to late childhood (4 months to 11 years), and ST3: adolescence to adulthood (13 - 23 years)
The bar shown representes the lower 25% and upper 25% of the expression distribution.
Top co-expressed genes in brain regions
| Top 10 positively co-expressed genes | ||
| Gene | Pearson's Correlation | Spearman's Correlation |
| MFAP1 | 0.95 | 0.94 |
| SF3A3 | 0.94 | 0.95 |
| RNF20 | 0.94 | 0.95 |
| TARDBP | 0.94 | 0.95 |
| SUPT16H | 0.94 | 0.95 |
| NCL | 0.94 | 0.95 |
| CRNKL1 | 0.93 | 0.94 |
| SNW1 | 0.93 | 0.94 |
| ZNF131 | 0.93 | 0.94 |
| CTR9 | 0.93 | 0.96 |
| Top 10 negatively co-expressed genes | ||
| Gene | Pearson's Correlation | Spearman's Correlation |
| AF347015.31 | -0.79 | -0.87 |
| MT-CO2 | -0.78 | -0.86 |
| IFI27 | -0.78 | -0.88 |
| FXYD1 | -0.78 | -0.87 |
| AF347015.33 | -0.77 | -0.84 |
| AF347015.27 | -0.76 | -0.84 |
| HIGD1B | -0.75 | -0.85 |
| MT-CYB | -0.75 | -0.83 |
| AF347015.8 | -0.75 | -0.84 |
| AF347015.21 | -0.73 | -0.84 |
Section V. Pathway annotation
| Pathway name | Pathway size | # SZGR 2.0 genes in pathway | Info |
|---|---|---|---|
| HOLLMANN APOPTOSIS VIA CD40 DN | 267 | 178 | All SZGR 2.0 genes in this pathway |
| CHEMNITZ RESPONSE TO PROSTAGLANDIN E2 DN | 391 | 222 | All SZGR 2.0 genes in this pathway |
| DAVICIONI MOLECULAR ARMS VS ERMS UP | 332 | 228 | All SZGR 2.0 genes in this pathway |
| LIU CMYB TARGETS UP | 165 | 106 | All SZGR 2.0 genes in this pathway |
| LIU VMYB TARGETS UP | 127 | 78 | All SZGR 2.0 genes in this pathway |
| RODRIGUES NTN1 TARGETS UP | 17 | 11 | All SZGR 2.0 genes in this pathway |
| VANHARANTA UTERINE FIBROID UP | 45 | 26 | All SZGR 2.0 genes in this pathway |
| DACOSTA UV RESPONSE VIA ERCC3 DN | 855 | 609 | All SZGR 2.0 genes in this pathway |
| DACOSTA UV RESPONSE VIA ERCC3 COMMON DN | 483 | 336 | All SZGR 2.0 genes in this pathway |
| SHETH LIVER CANCER VS TXNIP LOSS PAM1 | 229 | 137 | All SZGR 2.0 genes in this pathway |
| NUYTTEN NIPP1 TARGETS UP | 769 | 437 | All SZGR 2.0 genes in this pathway |
| BENPORATH ES WITH H3K27ME3 | 1118 | 744 | All SZGR 2.0 genes in this pathway |
| GEORGES TARGETS OF MIR192 AND MIR215 | 893 | 528 | All SZGR 2.0 genes in this pathway |
| ONDER CDH1 TARGETS 2 UP | 256 | 159 | All SZGR 2.0 genes in this pathway |
| GENTILE UV RESPONSE CLUSTER D2 | 41 | 30 | All SZGR 2.0 genes in this pathway |
| GENTILE UV HIGH DOSE DN | 312 | 203 | All SZGR 2.0 genes in this pathway |
| GENTILE UV LOW DOSE DN | 67 | 46 | All SZGR 2.0 genes in this pathway |
| RIGGINS TAMOXIFEN RESISTANCE DN | 220 | 147 | All SZGR 2.0 genes in this pathway |
| ACEVEDO LIVER TUMOR VS NORMAL ADJACENT TISSUE UP | 863 | 514 | All SZGR 2.0 genes in this pathway |
| ACEVEDO LIVER CANCER WITH H3K27ME3 DN | 228 | 114 | All SZGR 2.0 genes in this pathway |
| IZADPANAH STEM CELL ADIPOSE VS BONE UP | 126 | 92 | All SZGR 2.0 genes in this pathway |
| CADWELL ATG16L1 TARGETS DN | 70 | 43 | All SZGR 2.0 genes in this pathway |
| MEISSNER BRAIN HCP WITH H3K4ME3 AND H3K27ME3 | 1069 | 729 | All SZGR 2.0 genes in this pathway |
| BOYAULT LIVER CANCER SUBCLASS G2 | 27 | 17 | All SZGR 2.0 genes in this pathway |
| LU EZH2 TARGETS DN | 414 | 237 | All SZGR 2.0 genes in this pathway |
| PASINI SUZ12 TARGETS UP | 112 | 65 | All SZGR 2.0 genes in this pathway |
| IKEDA MIR30 TARGETS DN | 27 | 24 | All SZGR 2.0 genes in this pathway |
| PHONG TNF RESPONSE VIA P38 COMPLETE | 227 | 151 | All SZGR 2.0 genes in this pathway |