Gene Page: ESYT1
Summary ?
| GeneID | 23344 |
| Symbol | ESYT1 |
| Synonyms | FAM62A|MBC2 |
| Description | extended synaptotagmin protein 1 |
| Reference | MIM:616670|HGNC:HGNC:29534|Ensembl:ENSG00000139641|HPRD:14367|Vega:OTTHUMG00000170197 |
| Gene type | protein-coding |
| Map location | 12q13.2 |
| Pascal p-value | 0.685 |
| Sherlock p-value | 0.238 |
| Fetal beta | -1.565 |
| DMG | 1 (# studies) |
| eGene | Myers' cis & trans |
| Support | Ascano FMRP targets |
Gene in Data Sources
| Gene set name | Method of gene set | Description | Info |
|---|---|---|---|
| CV:PGCnp | Genome-wide Association Study | GWAS | |
| DMG:Wockner_2014 | Genome-wide DNA methylation analysis | This dataset includes 4641 differentially methylated probes corresponding to 2929 unique genes between schizophrenia patients (n=24) and controls (n=24). | 1 |
Section I. Genetics and epigenetics annotation
 Differentially methylated gene
| Probe | Chromosome | Position | Nearest gene | P (dis) | Beta (dis) | FDR (dis) | Study |
|---|---|---|---|---|---|---|---|
| cg14752451 | 12 | 56525349 | ESYT1 | 3.528E-4 | 0.476 | 0.042 | DMG:Wockner_2014 |
eQTL annotation
| SNP ID | Chromosome | Position | eGene | Gene Entrez ID | pvalue | qvalue | TSS distance | eQTL type |
|---|---|---|---|---|---|---|---|---|
| rs11851301 | chr14 | 95174265 | ESYT1 | 23344 | 0.17 | trans |
Section II. Transcriptome annotation
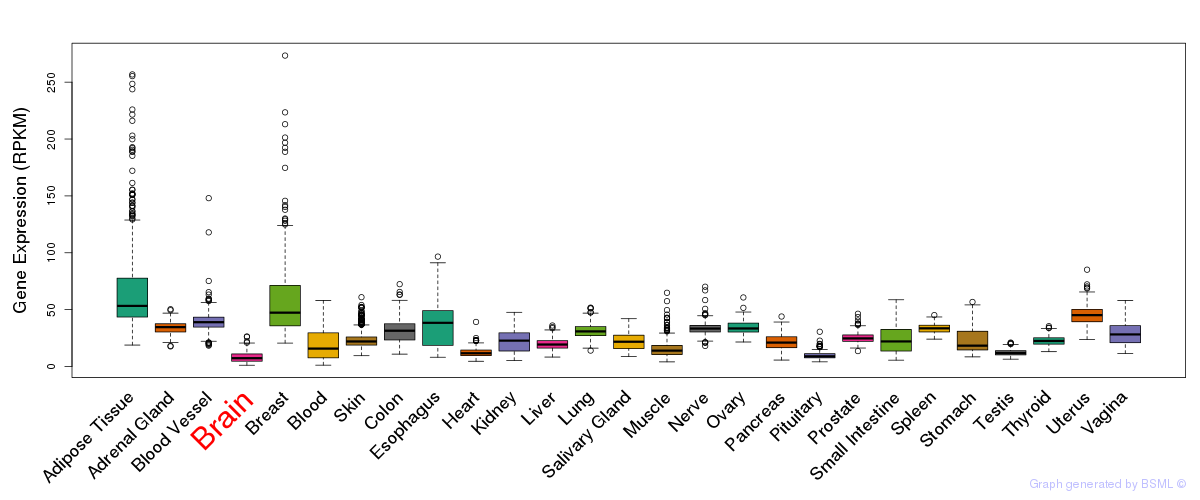
General gene expression (GTEx)
Gene expression during devlopment (BrainCloud)
Footnote:
A total of 269 time points ploted, with n=38 fetal samples (x=1:38). Each triangle represents one time point.
Gene expression of temporal and spatial changes (BrainSpan)
Footnote:
SC: sub-cortical regions; SM: sensory-motor regions; FC: frontal cortex; and TP: temporal-parietal cortex
ST1: fetal (13 - 26 postconception weeks), ST2: early infancy to late childhood (4 months to 11 years), and ST3: adolescence to adulthood (13 - 23 years)
The bar shown representes the lower 25% and upper 25% of the expression distribution.
Top co-expressed genes in brain regions
| Top 10 positively co-expressed genes | ||
| Gene | Pearson's Correlation | Spearman's Correlation |
| CBY1 | 0.85 | 0.83 |
| RANBP1 | 0.84 | 0.84 |
| DUSP12 | 0.84 | 0.84 |
| BAT1 | 0.84 | 0.82 |
| IFT52 | 0.83 | 0.86 |
| EIF4A3 | 0.83 | 0.81 |
| DYNLT1 | 0.83 | 0.81 |
| DNAJC9 | 0.83 | 0.77 |
| PPP4C | 0.83 | 0.84 |
| FANCG | 0.83 | 0.81 |
| Top 10 negatively co-expressed genes | ||
| Gene | Pearson's Correlation | Spearman's Correlation |
| HLA-F | -0.69 | -0.72 |
| TINAGL1 | -0.67 | -0.75 |
| AF347015.27 | -0.67 | -0.74 |
| AF347015.33 | -0.66 | -0.75 |
| FBXO2 | -0.65 | -0.66 |
| MT-CO2 | -0.65 | -0.73 |
| AF347015.15 | -0.65 | -0.76 |
| MT-CYB | -0.64 | -0.74 |
| AF347015.8 | -0.64 | -0.74 |
| PTGDS | -0.64 | -0.72 |
Section V. Pathway annotation
| Pathway name | Pathway size | # SZGR 2.0 genes in pathway | Info |
|---|---|---|---|
| LIU CMYB TARGETS UP | 165 | 106 | All SZGR 2.0 genes in this pathway |
| MULLIGHAN NPM1 MUTATED SIGNATURE 1 DN | 126 | 86 | All SZGR 2.0 genes in this pathway |
| MULLIGHAN NPM1 SIGNATURE 3 DN | 162 | 116 | All SZGR 2.0 genes in this pathway |
| GRAESSMANN APOPTOSIS BY DOXORUBICIN UP | 1142 | 669 | All SZGR 2.0 genes in this pathway |
| MATTIOLI MGUS VS PCL | 116 | 62 | All SZGR 2.0 genes in this pathway |
| LI WILMS TUMOR VS FETAL KIDNEY 1 DN | 163 | 115 | All SZGR 2.0 genes in this pathway |
| RUAN RESPONSE TO TNF DN | 84 | 50 | All SZGR 2.0 genes in this pathway |
| DEBIASI APOPTOSIS BY REOVIRUS INFECTION DN | 287 | 208 | All SZGR 2.0 genes in this pathway |
| BRACHAT RESPONSE TO CAMPTOTHECIN DN | 46 | 31 | All SZGR 2.0 genes in this pathway |
| CREIGHTON ENDOCRINE THERAPY RESISTANCE 1 | 528 | 324 | All SZGR 2.0 genes in this pathway |
| LEIN PONS MARKERS | 89 | 59 | All SZGR 2.0 genes in this pathway |
| LEIN MEDULLA MARKERS | 81 | 48 | All SZGR 2.0 genes in this pathway |
| WANG TUMOR INVASIVENESS DN | 210 | 128 | All SZGR 2.0 genes in this pathway |
| HINATA NFKB TARGETS KERATINOCYTE DN | 23 | 15 | All SZGR 2.0 genes in this pathway |
| MILI PSEUDOPODIA CHEMOTAXIS DN | 457 | 302 | All SZGR 2.0 genes in this pathway |
| MILI PSEUDOPODIA HAPTOTAXIS DN | 668 | 419 | All SZGR 2.0 genes in this pathway |
| KIM ALL DISORDERS OLIGODENDROCYTE NUMBER CORR UP | 756 | 494 | All SZGR 2.0 genes in this pathway |
| KIM ALL DISORDERS DURATION CORR DN | 146 | 90 | All SZGR 2.0 genes in this pathway |
| ACOSTA PROLIFERATION INDEPENDENT MYC TARGETS DN | 116 | 74 | All SZGR 2.0 genes in this pathway |
| WAKABAYASHI ADIPOGENESIS PPARG RXRA BOUND 8D | 882 | 506 | All SZGR 2.0 genes in this pathway |