Gene Page: HARS2
Summary ?
| GeneID | 23438 |
| Symbol | HARS2 |
| Synonyms | HARSL|HARSR|HO3|PRLTS2 |
| Description | histidyl-tRNA synthetase 2, mitochondrial |
| Reference | MIM:600783|HGNC:HGNC:4817|Ensembl:ENSG00000112855|HPRD:02871|Vega:OTTHUMG00000129500 |
| Gene type | protein-coding |
| Map location | 5q31.3 |
| Pascal p-value | 5.835E-6 |
| Sherlock p-value | 0.944 |
| Fetal beta | 0.556 |
| DMG | 1 (# studies) |
| eGene | Myers' cis & trans |
| Support | Ascano FMRP targets |
Gene in Data Sources
| Gene set name | Method of gene set | Description | Info |
|---|---|---|---|
| CV:PGCnp | Genome-wide Association Study | GWAS | |
| DMG:Jaffe_2016 | Genome-wide DNA methylation analysis | This dataset includes 2,104 probes/CpGs associated with SZ patients (n=108) compared to 136 controls at Bonferroni-adjusted P < 0.05. | 1 |
| GSMA_I | Genome scan meta-analysis | Psr: 0.0032 |
Section I. Genetics and epigenetics annotation
 Differentially methylated gene
| Probe | Chromosome | Position | Nearest gene | P (dis) | Beta (dis) | FDR (dis) | Study |
|---|---|---|---|---|---|---|---|
| cg09368129 | 5 | 140071347 | HARS2 | 1.42E-8 | -0.016 | 5.5E-6 | DMG:Jaffe_2016 |
eQTL annotation
| SNP ID | Chromosome | Position | eGene | Gene Entrez ID | pvalue | qvalue | TSS distance | eQTL type |
|---|---|---|---|---|---|---|---|---|
| rs36781 | chr5 | 109289728 | HARS2 | 23438 | 0.1 | trans | ||
| rs11649061 | chr16 | 65597499 | HARS2 | 23438 | 0.19 | trans |
Section II. Transcriptome annotation
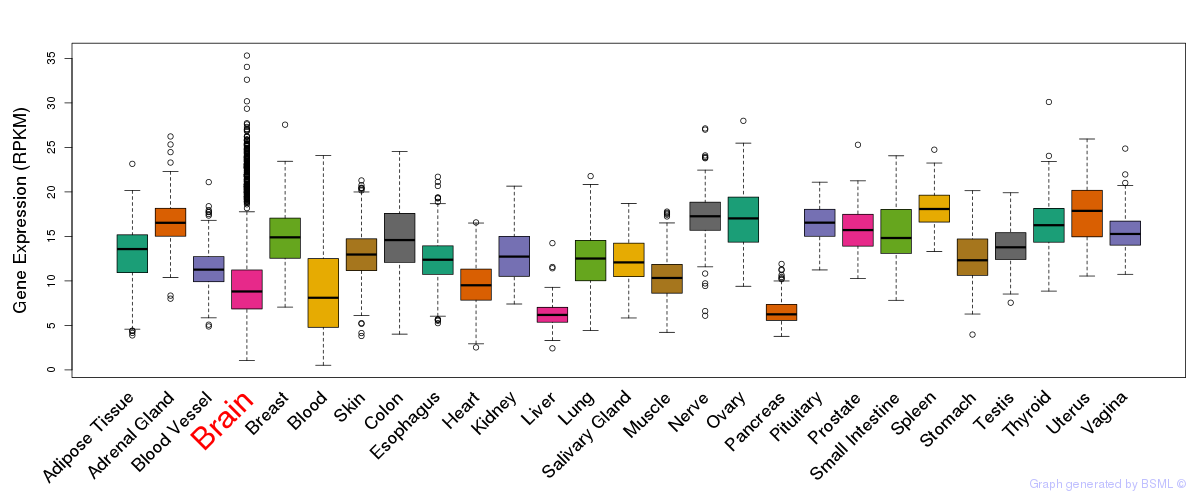
General gene expression (GTEx)
Gene expression during devlopment (BrainCloud)
Footnote:
A total of 269 time points ploted, with n=38 fetal samples (x=1:38). Each triangle represents one time point.
Gene expression of temporal and spatial changes (BrainSpan)
Footnote:
SC: sub-cortical regions; SM: sensory-motor regions; FC: frontal cortex; and TP: temporal-parietal cortex
ST1: fetal (13 - 26 postconception weeks), ST2: early infancy to late childhood (4 months to 11 years), and ST3: adolescence to adulthood (13 - 23 years)
The bar shown representes the lower 25% and upper 25% of the expression distribution.
No co-expressed genes in brain regions
Section III. Gene Ontology annotation
| Molecular function | GO term | Evidence | Neuro keywords | PubMed ID |
|---|---|---|---|---|
| GO:0000166 | nucleotide binding | IEA | - | |
| GO:0005524 | ATP binding | NAS | - | |
| GO:0004821 | histidine-tRNA ligase activity | NAS | 7755634 | |
| GO:0016874 | ligase activity | IEA | - | |
| Biological process | GO term | Evidence | Neuro keywords | PubMed ID |
| GO:0006427 | histidyl-tRNA aminoacylation | IEA | - | |
| Cellular component | GO term | Evidence | Neuro keywords | PubMed ID |
| GO:0005737 | cytoplasm | NAS | - | |
| GO:0005739 | mitochondrion | IEA | - | |
| GO:0005759 | mitochondrial matrix | IEA | - |
Section V. Pathway annotation
| Pathway name | Pathway size | # SZGR 2.0 genes in pathway | Info |
|---|---|---|---|
| KEGG AMINOACYL TRNA BIOSYNTHESIS | 41 | 33 | All SZGR 2.0 genes in this pathway |
| REACTOME MITOCHONDRIAL TRNA AMINOACYLATION | 21 | 17 | All SZGR 2.0 genes in this pathway |
| REACTOME TRNA AMINOACYLATION | 42 | 34 | All SZGR 2.0 genes in this pathway |
| WATANABE RECTAL CANCER RADIOTHERAPY RESPONSIVE DN | 92 | 51 | All SZGR 2.0 genes in this pathway |
| SHEPARD CRUSH AND BURN MUTANT UP | 197 | 110 | All SZGR 2.0 genes in this pathway |
| YAGI AML SURVIVAL | 129 | 87 | All SZGR 2.0 genes in this pathway |
| ZHANG RESPONSE TO CANTHARIDIN DN | 69 | 46 | All SZGR 2.0 genes in this pathway |
| ACEVEDO LIVER CANCER UP | 973 | 570 | All SZGR 2.0 genes in this pathway |
| ACEVEDO LIVER TUMOR VS NORMAL ADJACENT TISSUE UP | 863 | 514 | All SZGR 2.0 genes in this pathway |
| YAGI AML WITH INV 16 TRANSLOCATION | 422 | 277 | All SZGR 2.0 genes in this pathway |
| PILON KLF1 TARGETS UP | 504 | 321 | All SZGR 2.0 genes in this pathway |