Gene Page: SLC16A8
Summary ?
| GeneID | 23539 |
| Symbol | SLC16A8 |
| Synonyms | MCT3|REMP |
| Description | solute carrier family 16 member 8 |
| Reference | MIM:610409|HGNC:HGNC:16270|Ensembl:ENSG00000100156|HPRD:11568|Vega:OTTHUMG00000151196 |
| Gene type | protein-coding |
| Map location | 22q13.1 |
| Pascal p-value | 0.312 |
| DMG | 1 (# studies) |
Gene in Data Sources
| Gene set name | Method of gene set | Description | Info |
|---|---|---|---|
| CV:PGCnp | Genome-wide Association Study | GWAS | |
| DMG:Wockner_2014 | Genome-wide DNA methylation analysis | This dataset includes 4641 differentially methylated probes corresponding to 2929 unique genes between schizophrenia patients (n=24) and controls (n=24). | 1 |
Section I. Genetics and epigenetics annotation
 Differentially methylated gene
| Probe | Chromosome | Position | Nearest gene | P (dis) | Beta (dis) | FDR (dis) | Study |
|---|---|---|---|---|---|---|---|
| cg11324504 | 22 | 38474147 | SLC16A8 | 1.643E-4 | 0.331 | 0.033 | DMG:Wockner_2014 |
Section II. Transcriptome annotation
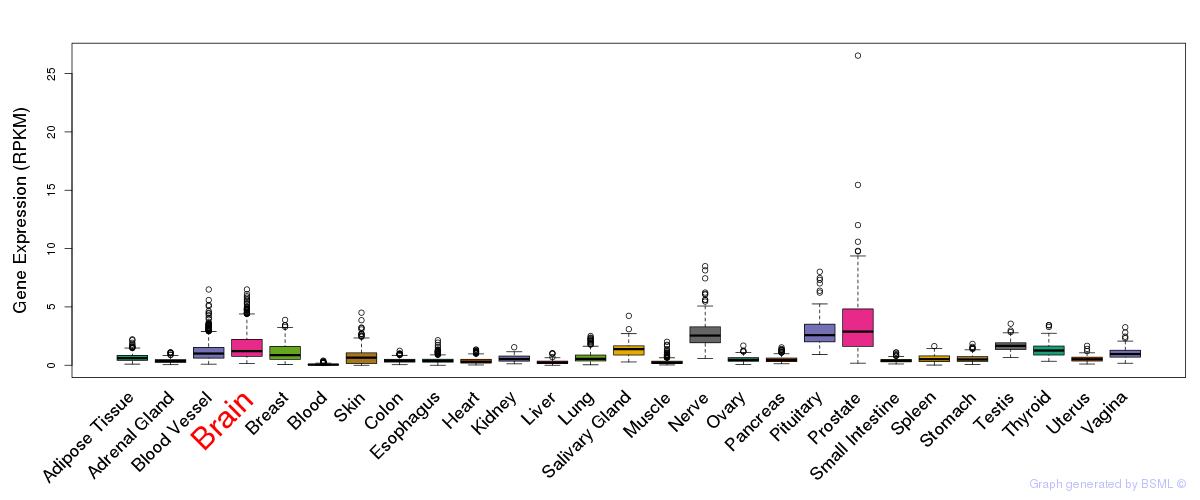
General gene expression (GTEx)
Gene expression of temporal and spatial changes (BrainSpan)
Footnote:
SC: sub-cortical regions; SM: sensory-motor regions; FC: frontal cortex; and TP: temporal-parietal cortex
ST1: fetal (13 - 26 postconception weeks), ST2: early infancy to late childhood (4 months to 11 years), and ST3: adolescence to adulthood (13 - 23 years)
The bar shown representes the lower 25% and upper 25% of the expression distribution.
Top co-expressed genes in brain regions
| Top 10 positively co-expressed genes | ||
| Gene | Pearson's Correlation | Spearman's Correlation |
| LONP2 | 0.90 | 0.88 |
| SCRN1 | 0.89 | 0.90 |
| KIAA1737 | 0.89 | 0.88 |
| C6orf89 | 0.88 | 0.88 |
| TBC1D5 | 0.88 | 0.89 |
| MTMR15 | 0.88 | 0.85 |
| KIAA0100 | 0.88 | 0.88 |
| MYST2 | 0.88 | 0.87 |
| RAB5B | 0.88 | 0.86 |
| PTK2 | 0.88 | 0.86 |
| Top 10 negatively co-expressed genes | ||
| Gene | Pearson's Correlation | Spearman's Correlation |
| AF347015.21 | -0.69 | -0.54 |
| IL32 | -0.62 | -0.51 |
| MT-CO2 | -0.60 | -0.49 |
| AF347015.8 | -0.59 | -0.48 |
| AF347015.31 | -0.59 | -0.49 |
| AF347015.18 | -0.58 | -0.48 |
| C1orf54 | -0.58 | -0.54 |
| CSAG1 | -0.58 | -0.48 |
| HIGD1B | -0.57 | -0.46 |
| MT-CYB | -0.56 | -0.45 |
Section V. Pathway annotation
| Pathway name | Pathway size | # SZGR 2.0 genes in pathway | Info |
|---|---|---|---|
| REACTOME PYRUVATE METABOLISM AND CITRIC ACID TCA CYCLE | 48 | 32 | All SZGR 2.0 genes in this pathway |
| REACTOME TCA CYCLE AND RESPIRATORY ELECTRON TRANSPORT | 141 | 85 | All SZGR 2.0 genes in this pathway |
| REACTOME CELL SURFACE INTERACTIONS AT THE VASCULAR WALL | 91 | 65 | All SZGR 2.0 genes in this pathway |
| REACTOME BASIGIN INTERACTIONS | 30 | 23 | All SZGR 2.0 genes in this pathway |
| REACTOME TRANSMEMBRANE TRANSPORT OF SMALL MOLECULES | 413 | 270 | All SZGR 2.0 genes in this pathway |
| REACTOME SLC MEDIATED TRANSMEMBRANE TRANSPORT | 241 | 157 | All SZGR 2.0 genes in this pathway |
| REACTOME TRANSPORT OF GLUCOSE AND OTHER SUGARS BILE SALTS AND ORGANIC ACIDS METAL IONS AND AMINE COMPOUNDS | 89 | 54 | All SZGR 2.0 genes in this pathway |
| REACTOME BILE SALT AND ORGANIC ANION SLC TRANSPORTERS | 11 | 6 | All SZGR 2.0 genes in this pathway |
| REACTOME PYRUVATE METABOLISM | 19 | 14 | All SZGR 2.0 genes in this pathway |
| REACTOME HEMOSTASIS | 466 | 331 | All SZGR 2.0 genes in this pathway |
| MIKKELSEN MEF LCP WITH H3K27ME3 | 70 | 35 | All SZGR 2.0 genes in this pathway |
| MARTENS TRETINOIN RESPONSE UP | 857 | 456 | All SZGR 2.0 genes in this pathway |