Gene Page: CALHM1
Summary ?
| GeneID | 255022 |
| Symbol | CALHM1 |
| Synonyms | FAM26C |
| Description | calcium homeostasis modulator 1 |
| Reference | MIM:612234|HGNC:HGNC:23494|Ensembl:ENSG00000185933|HPRD:16879|Vega:OTTHUMG00000018991 |
| Gene type | protein-coding |
| Map location | 10q24.33 |
| Pascal p-value | 0.008 |
| Fetal beta | -0.783 |
| eGene | Putamen basal ganglia Meta |
Gene in Data Sources
| Gene set name | Method of gene set | Description | Info |
|---|---|---|---|
| CV:PGCnp | Genome-wide Association Study | GWAS | |
| LK:YES | Genome-wide Association Study | This data set included 99 genes mapped to the 22 regions. The 24 leading SNPs were also included in CV:Ripke_2013 |
Section I. Genetics and epigenetics annotation
 eQTL annotation
| SNP ID | Chromosome | Position | eGene | Gene Entrez ID | pvalue | qvalue | TSS distance | eQTL type |
|---|---|---|---|---|---|---|---|---|
| rs7085419 | 10 | 105477212 | CALHM1 | ENSG00000185933.6 | 1.9154E-6 | 0.02 | -258567 | gtex_brain_putamen_basal |
Section II. Transcriptome annotation
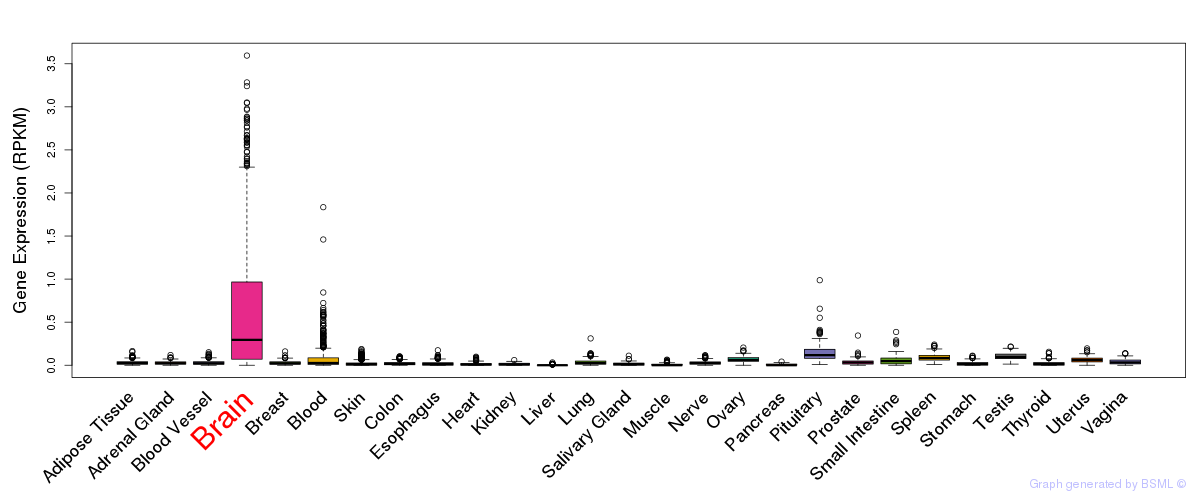
General gene expression (GTEx)
Gene expression during devlopment (BrainCloud)
Footnote:
A total of 269 time points ploted, with n=38 fetal samples (x=1:38). Each triangle represents one time point.
Gene expression of temporal and spatial changes (BrainSpan)
Footnote:
SC: sub-cortical regions; SM: sensory-motor regions; FC: frontal cortex; and TP: temporal-parietal cortex
ST1: fetal (13 - 26 postconception weeks), ST2: early infancy to late childhood (4 months to 11 years), and ST3: adolescence to adulthood (13 - 23 years)
The bar shown representes the lower 25% and upper 25% of the expression distribution.