Gene Page: RAB3GAP2
Summary ?
| GeneID | 25782 |
| Symbol | RAB3GAP2 |
| Synonyms | RAB3-GAP150|RAB3GAP150|SPG69|WARBM2|p150 |
| Description | RAB3 GTPase activating non-catalytic protein subunit 2 |
| Reference | MIM:609275|HGNC:HGNC:17168|Ensembl:ENSG00000118873|HPRD:11471|Vega:OTTHUMG00000037139 |
| Gene type | protein-coding |
| Map location | 1q41 |
| Sherlock p-value | 0.293 |
| Fetal beta | -0.003 |
| DMG | 1 (# studies) |
| eGene | Myers' cis & trans |
| Support | G2Cdb.human_BAYES-COLLINS-HUMAN-PSD-CONSENSUS CompositeSet |
Gene in Data Sources
| Gene set name | Method of gene set | Description | Info |
|---|---|---|---|
| CV:PGCnp | Genome-wide Association Study | GWAS | |
| DMG:Nishioka_2013 | Genome-wide DNA methylation analysis | The authors investigated the methylation profiles of DNA in peripheral blood cells from 18 patients with first-episode schizophrenia (FESZ) and from 15 normal controls. | 1 |
| Network | Shortest path distance of core genes in the Human protein-protein interaction network | Contribution to shortest path in PPI network: 0.2324 |
Section I. Genetics and epigenetics annotation
 Differentially methylated gene
| Probe | Chromosome | Position | Nearest gene | P (dis) | Beta (dis) | FDR (dis) | Study |
|---|---|---|---|---|---|---|---|
| cg12054080 | 1 | 220446043 | RAB3GAP2 | -0.033 | 0.36 | DMG:Nishioka_2013 |
eQTL annotation
| SNP ID | Chromosome | Position | eGene | Gene Entrez ID | pvalue | qvalue | TSS distance | eQTL type |
|---|---|---|---|---|---|---|---|---|
| rs10994209 | chr10 | 61877705 | RAB3GAP2 | 25782 | 0.11 | trans |
Section II. Transcriptome annotation
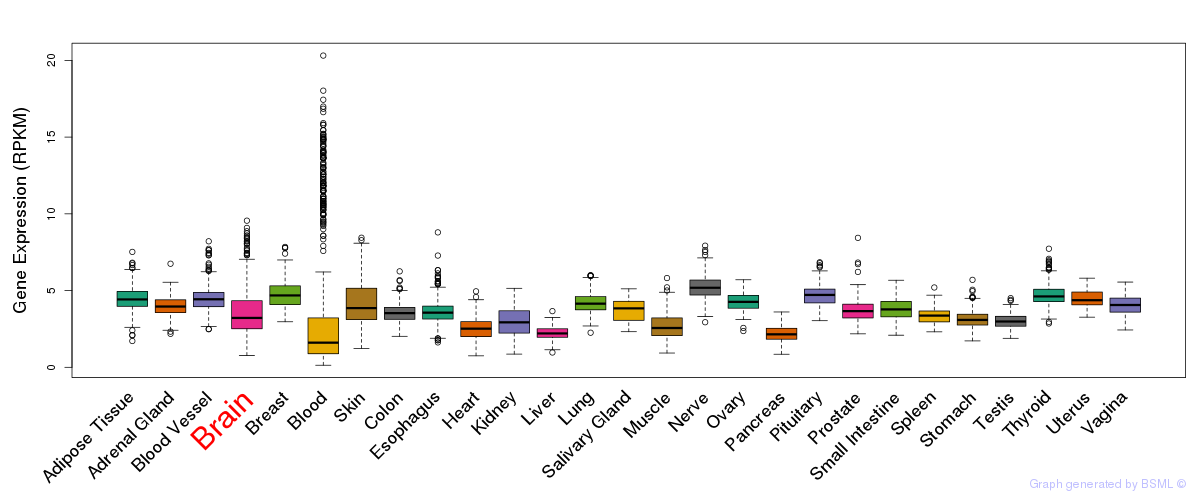
General gene expression (GTEx)
Gene expression during devlopment (BrainCloud)
Footnote:
A total of 269 time points ploted, with n=38 fetal samples (x=1:38). Each triangle represents one time point.
Gene expression of temporal and spatial changes (BrainSpan)
Footnote:
SC: sub-cortical regions; SM: sensory-motor regions; FC: frontal cortex; and TP: temporal-parietal cortex
ST1: fetal (13 - 26 postconception weeks), ST2: early infancy to late childhood (4 months to 11 years), and ST3: adolescence to adulthood (13 - 23 years)
The bar shown representes the lower 25% and upper 25% of the expression distribution.
Top co-expressed genes in brain regions
| Top 10 positively co-expressed genes | ||
| Gene | Pearson's Correlation | Spearman's Correlation |
| ARFGEF2 | 0.93 | 0.89 |
| GLS | 0.93 | 0.86 |
| FAM179B | 0.93 | 0.90 |
| FAM126B | 0.92 | 0.91 |
| PREPL | 0.92 | 0.89 |
| NCOA7 | 0.92 | 0.89 |
| DPP8 | 0.92 | 0.85 |
| CHM | 0.92 | 0.89 |
| SYNJ1 | 0.92 | 0.87 |
| SYT1 | 0.91 | 0.90 |
| Top 10 negatively co-expressed genes | ||
| Gene | Pearson's Correlation | Spearman's Correlation |
| EFEMP2 | -0.53 | -0.61 |
| DBI | -0.48 | -0.61 |
| RAB34 | -0.48 | -0.61 |
| RHOC | -0.48 | -0.62 |
| GATSL3 | -0.47 | -0.56 |
| C1orf61 | -0.46 | -0.70 |
| NKAIN4 | -0.45 | -0.57 |
| EIF4EBP3 | -0.44 | -0.53 |
| ACSF2 | -0.43 | -0.53 |
| RAB13 | -0.42 | -0.55 |
Section III. Gene Ontology annotation
| Molecular function | GO term | Evidence | Neuro keywords | PubMed ID |
|---|---|---|---|---|
| GO:0005096 | GTPase activator activity | TAS | 9733780 | |
| GO:0005515 | protein binding | IPI | 17353931 | |
| GO:0046982 | protein heterodimerization activity | ISS | - | |
| Biological process | GO term | Evidence | Neuro keywords | PubMed ID |
| GO:0006886 | intracellular protein transport | TAS | 9733780 | |
| GO:0043087 | regulation of GTPase activity | ISS | - | |
| Cellular component | GO term | Evidence | Neuro keywords | PubMed ID |
| GO:0005625 | soluble fraction | ISS | - | |
| GO:0005737 | cytoplasm | IEA | - |
Section V. Pathway annotation
| Pathway name | Pathway size | # SZGR 2.0 genes in pathway | Info |
|---|---|---|---|
| ZHOU INFLAMMATORY RESPONSE LIVE UP | 485 | 293 | All SZGR 2.0 genes in this pathway |
| WANG LMO4 TARGETS UP | 372 | 227 | All SZGR 2.0 genes in this pathway |
| OSWALD HEMATOPOIETIC STEM CELL IN COLLAGEN GEL DN | 275 | 168 | All SZGR 2.0 genes in this pathway |
| ODONNELL TFRC TARGETS UP | 456 | 228 | All SZGR 2.0 genes in this pathway |
| ZHOU INFLAMMATORY RESPONSE FIMA UP | 544 | 308 | All SZGR 2.0 genes in this pathway |
| SCIBETTA KDM5B TARGETS DN | 81 | 55 | All SZGR 2.0 genes in this pathway |
| RODRIGUES THYROID CARCINOMA POORLY DIFFERENTIATED DN | 805 | 505 | All SZGR 2.0 genes in this pathway |
| RODRIGUES THYROID CARCINOMA ANAPLASTIC DN | 537 | 339 | All SZGR 2.0 genes in this pathway |
| PATIL LIVER CANCER | 747 | 453 | All SZGR 2.0 genes in this pathway |
| PUJANA BRCA1 PCC NETWORK | 1652 | 1023 | All SZGR 2.0 genes in this pathway |
| PUJANA ATM PCC NETWORK | 1442 | 892 | All SZGR 2.0 genes in this pathway |
| LIAO METASTASIS | 539 | 324 | All SZGR 2.0 genes in this pathway |
| BENPORATH NANOG TARGETS | 988 | 594 | All SZGR 2.0 genes in this pathway |
| BENPORATH SOX2 TARGETS | 734 | 436 | All SZGR 2.0 genes in this pathway |
| BENPORATH MYC MAX TARGETS | 775 | 494 | All SZGR 2.0 genes in this pathway |
| CUI TCF21 TARGETS 2 DN | 830 | 547 | All SZGR 2.0 genes in this pathway |
| BROWNE HCMV INFECTION 14HR DN | 298 | 200 | All SZGR 2.0 genes in this pathway |
| ACEVEDO NORMAL TISSUE ADJACENT TO LIVER TUMOR DN | 354 | 216 | All SZGR 2.0 genes in this pathway |
| DANG BOUND BY MYC | 1103 | 714 | All SZGR 2.0 genes in this pathway |
| GABRIELY MIR21 TARGETS | 289 | 187 | All SZGR 2.0 genes in this pathway |
| PURBEY TARGETS OF CTBP1 NOT SATB1 UP | 344 | 215 | All SZGR 2.0 genes in this pathway |
| GOBERT OLIGODENDROCYTE DIFFERENTIATION DN | 1080 | 713 | All SZGR 2.0 genes in this pathway |
| SMIRNOV RESPONSE TO IR 2HR DN | 55 | 35 | All SZGR 2.0 genes in this pathway |
Section VI. microRNA annotation
| miRNA family | Target position | miRNA ID | miRNA seq | ||
|---|---|---|---|---|---|
| UTR start | UTR end | Match method | |||
| miR-369-3p | 757 | 763 | m8 | hsa-miR-369-3p | AAUAAUACAUGGUUGAUCUUU |
- SZ: miRNAs which differentially expressed in brain cortex of schizophrenia patients comparing with control samples using microarray. Click here to see the list of SZ related miRNAs.
- Brain: miRNAs which are expressed in brain based on miRNA microarray expression studies. Click here to see the list of brain related miRNAs.