Gene Page: TMEM59L
Summary ?
| GeneID | 25789 |
| Symbol | TMEM59L |
| Synonyms | BSMAP|C19orf4 |
| Description | transmembrane protein 59 like |
| Reference | HGNC:HGNC:13237|Ensembl:ENSG00000105696|HPRD:12709|Vega:OTTHUMG00000183113 |
| Gene type | protein-coding |
| Map location | 19p12 |
| Pascal p-value | 0.082 |
| Sherlock p-value | 0.451 |
| DMG | 1 (# studies) |
Gene in Data Sources
| Gene set name | Method of gene set | Description | Info |
|---|---|---|---|
| CV:PGCnp | Genome-wide Association Study | GWAS | |
| DMG:Jaffe_2016 | Genome-wide DNA methylation analysis | This dataset includes 2,104 probes/CpGs associated with SZ patients (n=108) compared to 136 controls at Bonferroni-adjusted P < 0.05. | 1 |
Section I. Genetics and epigenetics annotation
 Differentially methylated gene
| Probe | Chromosome | Position | Nearest gene | P (dis) | Beta (dis) | FDR (dis) | Study |
|---|---|---|---|---|---|---|---|
| cg10266386 | 19 | 18722956 | TMEM59L | 2.5E-8 | -0.015 | 8.04E-6 | DMG:Jaffe_2016 |
Section II. Transcriptome annotation
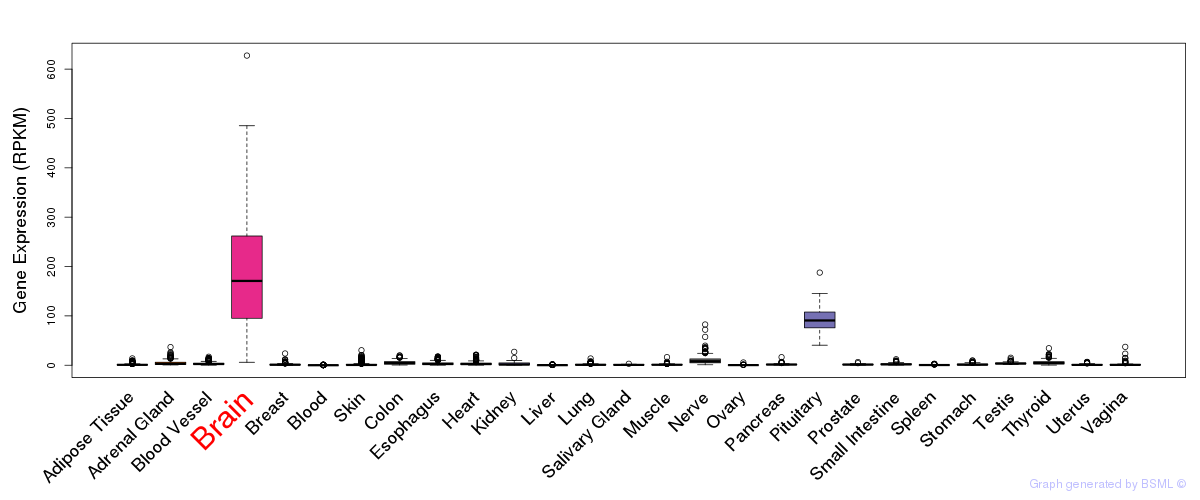
General gene expression (GTEx)
Gene expression of temporal and spatial changes (BrainSpan)
Footnote:
SC: sub-cortical regions; SM: sensory-motor regions; FC: frontal cortex; and TP: temporal-parietal cortex
ST1: fetal (13 - 26 postconception weeks), ST2: early infancy to late childhood (4 months to 11 years), and ST3: adolescence to adulthood (13 - 23 years)
The bar shown representes the lower 25% and upper 25% of the expression distribution.
Top co-expressed genes in brain regions
| Top 10 positively co-expressed genes | ||
| Gene | Pearson's Correlation | Spearman's Correlation |
| MYST4 | 0.97 | 0.96 |
| MYST3 | 0.95 | 0.94 |
| MED1 | 0.95 | 0.94 |
| SETD2 | 0.94 | 0.96 |
| ZNF609 | 0.94 | 0.93 |
| ARID1A | 0.94 | 0.95 |
| SMG1 | 0.94 | 0.92 |
| NSD1 | 0.94 | 0.95 |
| ZNF445 | 0.94 | 0.96 |
| YLPM1 | 0.94 | 0.95 |
| Top 10 negatively co-expressed genes | ||
| Gene | Pearson's Correlation | Spearman's Correlation |
| AIFM3 | -0.68 | -0.79 |
| HLA-F | -0.68 | -0.79 |
| ALDOC | -0.67 | -0.75 |
| C5orf53 | -0.67 | -0.77 |
| TSC22D4 | -0.67 | -0.83 |
| S100B | -0.67 | -0.88 |
| FBXO2 | -0.66 | -0.68 |
| SERPINB6 | -0.66 | -0.77 |
| CLU | -0.66 | -0.73 |
| HEPN1 | -0.66 | -0.75 |
Section V. Pathway annotation
| Pathway name | Pathway size | # SZGR 2.0 genes in pathway | Info |
|---|---|---|---|
| GAUSSMANN MLL AF4 FUSION TARGETS G UP | 238 | 135 | All SZGR 2.0 genes in this pathway |
| WATTEL AUTONOMOUS THYROID ADENOMA UP | 73 | 47 | All SZGR 2.0 genes in this pathway |
| BENPORATH SUZ12 TARGETS | 1038 | 678 | All SZGR 2.0 genes in this pathway |
| BENPORATH EED TARGETS | 1062 | 725 | All SZGR 2.0 genes in this pathway |
| BENPORATH ES WITH H3K27ME3 | 1118 | 744 | All SZGR 2.0 genes in this pathway |
| BENPORATH PRC2 TARGETS | 652 | 441 | All SZGR 2.0 genes in this pathway |
| STARK PREFRONTAL CORTEX 22Q11 DELETION DN | 517 | 309 | All SZGR 2.0 genes in this pathway |
| ROZANOV MMP14 TARGETS UP | 266 | 171 | All SZGR 2.0 genes in this pathway |
| MEISSNER NPC HCP WITH H3 UNMETHYLATED | 536 | 296 | All SZGR 2.0 genes in this pathway |
| MIKKELSEN MCV6 HCP WITH H3K27ME3 | 435 | 318 | All SZGR 2.0 genes in this pathway |
| MIKKELSEN IPS WITH HCP H3K27ME3 | 102 | 76 | All SZGR 2.0 genes in this pathway |
| MIKKELSEN MEF HCP WITH H3K27ME3 | 590 | 403 | All SZGR 2.0 genes in this pathway |
| MARTENS TRETINOIN RESPONSE UP | 857 | 456 | All SZGR 2.0 genes in this pathway |
| PILON KLF1 TARGETS UP | 504 | 321 | All SZGR 2.0 genes in this pathway |