Gene Page: TTLL1
Summary ?
| GeneID | 25809 |
| Symbol | TTLL1 |
| Synonyms | C22orf7|HS323M22B |
| Description | tubulin tyrosine ligase like 1 |
| Reference | MIM:608955|HGNC:HGNC:1312|Ensembl:ENSG00000100271|HPRD:10604|Vega:OTTHUMG00000150699 |
| Gene type | protein-coding |
| Map location | 22q13.1 |
| Pascal p-value | 1.787E-5 |
| Sherlock p-value | 0.868 |
| Fetal beta | 0.885 |
| DMG | 1 (# studies) |
| eGene | Caudate basal ganglia Cortex Nucleus accumbens basal ganglia Myers' cis & trans Meta |
Gene in Data Sources
| Gene set name | Method of gene set | Description | Info |
|---|---|---|---|
| CV:PGCnp | Genome-wide Association Study | GWAS | |
| DMG:Jaffe_2016 | Genome-wide DNA methylation analysis | This dataset includes 2,104 probes/CpGs associated with SZ patients (n=108) compared to 136 controls at Bonferroni-adjusted P < 0.05. | 1 |
Section I. Genetics and epigenetics annotation
 Differentially methylated gene
| Probe | Chromosome | Position | Nearest gene | P (dis) | Beta (dis) | FDR (dis) | Study |
|---|---|---|---|---|---|---|---|
| cg14021555 | 22 | 43485536 | TTLL1 | 2E-9 | -0.018 | 1.64E-6 | DMG:Jaffe_2016 |
eQTL annotation
| SNP ID | Chromosome | Position | eGene | Gene Entrez ID | pvalue | qvalue | TSS distance | eQTL type |
|---|---|---|---|---|---|---|---|---|
| rs1880949 | chr7 | 99722265 | TTLL1 | 25809 | 0.07 | trans |
Section II. Transcriptome annotation
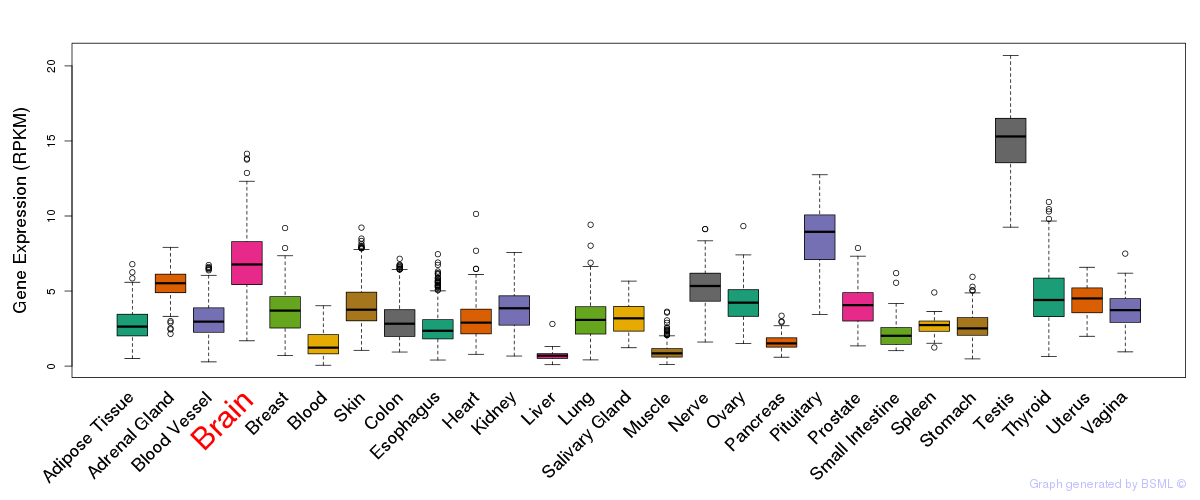
General gene expression (GTEx)
Gene expression during devlopment (BrainCloud)
Footnote:
A total of 269 time points ploted, with n=38 fetal samples (x=1:38). Each triangle represents one time point.
Gene expression of temporal and spatial changes (BrainSpan)
Footnote:
SC: sub-cortical regions; SM: sensory-motor regions; FC: frontal cortex; and TP: temporal-parietal cortex
ST1: fetal (13 - 26 postconception weeks), ST2: early infancy to late childhood (4 months to 11 years), and ST3: adolescence to adulthood (13 - 23 years)
The bar shown representes the lower 25% and upper 25% of the expression distribution.
Top co-expressed genes in brain regions
| Top 10 positively co-expressed genes | ||
| Gene | Pearson's Correlation | Spearman's Correlation |
| TRIM23 | 0.94 | 0.94 |
| AKAP10 | 0.93 | 0.93 |
| DMXL2 | 0.93 | 0.95 |
| NUFIP2 | 0.93 | 0.95 |
| GARNL1 | 0.93 | 0.93 |
| KIAA1128 | 0.93 | 0.94 |
| FBXO28 | 0.93 | 0.94 |
| TM9SF3 | 0.93 | 0.94 |
| BTRC | 0.93 | 0.93 |
| ZDHHC17 | 0.93 | 0.94 |
| Top 10 negatively co-expressed genes | ||
| Gene | Pearson's Correlation | Spearman's Correlation |
| FXYD1 | -0.64 | -0.65 |
| ENHO | -0.62 | -0.70 |
| HIGD1B | -0.61 | -0.64 |
| MT-CO2 | -0.60 | -0.63 |
| TLCD1 | -0.60 | -0.62 |
| CST3 | -0.60 | -0.63 |
| METRN | -0.59 | -0.65 |
| EIF4EBP3 | -0.59 | -0.64 |
| AF347015.21 | -0.59 | -0.59 |
| PLA2G5 | -0.59 | -0.63 |
Section V. Pathway annotation
| Pathway name | Pathway size | # SZGR 2.0 genes in pathway | Info |
|---|---|---|---|
| GRAESSMANN APOPTOSIS BY DOXORUBICIN UP | 1142 | 669 | All SZGR 2.0 genes in this pathway |
| GRAESSMANN RESPONSE TO MC AND DOXORUBICIN UP | 612 | 367 | All SZGR 2.0 genes in this pathway |
| AFFAR YY1 TARGETS UP | 214 | 133 | All SZGR 2.0 genes in this pathway |
| BROWNE HCMV INFECTION 18HR DN | 178 | 121 | All SZGR 2.0 genes in this pathway |
| BROWNE HCMV INFECTION 12HR DN | 101 | 64 | All SZGR 2.0 genes in this pathway |
| HELLER HDAC TARGETS UP | 317 | 208 | All SZGR 2.0 genes in this pathway |
| HELLER HDAC TARGETS SILENCED BY METHYLATION UP | 461 | 298 | All SZGR 2.0 genes in this pathway |
| ZHANG TLX TARGETS 36HR UP | 221 | 150 | All SZGR 2.0 genes in this pathway |
| ZHANG TLX TARGETS 60HR UP | 293 | 203 | All SZGR 2.0 genes in this pathway |
| ZHANG TLX TARGETS UP | 108 | 78 | All SZGR 2.0 genes in this pathway |
| ZWANG TRANSIENTLY UP BY 1ST EGF PULSE ONLY | 1839 | 928 | All SZGR 2.0 genes in this pathway |