Gene Page: AMBP
Summary ?
| GeneID | 259 |
| Symbol | AMBP |
| Synonyms | A1M|EDC1|HCP|HI30|IATIL|ITI|ITIL|ITILC|UTI |
| Description | alpha-1-microglobulin/bikunin precursor |
| Reference | MIM:176870|HGNC:HGNC:453|Ensembl:ENSG00000106927|HPRD:01467|Vega:OTTHUMG00000020534 |
| Gene type | protein-coding |
| Map location | 9q32-q33 |
| Pascal p-value | 0.867 |
| Fetal beta | -0.12 |
| eGene | Cerebellum Myers' cis & trans Meta |
Gene in Data Sources
| Gene set name | Method of gene set | Description | Info |
|---|---|---|---|
| CV:GWASdb | Genome-wide Association Studies | GWASdb records for schizophrenia |
Section I. Genetics and epigenetics annotation
 eQTL annotation
| SNP ID | Chromosome | Position | eGene | Gene Entrez ID | pvalue | qvalue | TSS distance | eQTL type |
|---|---|---|---|---|---|---|---|---|
| rs928641 | chr9 | 119927509 | AMBP | 259 | 0.12 | trans | ||
| rs977937 | chr9 | 119942648 | AMBP | 259 | 0.11 | trans |
Section II. Transcriptome annotation
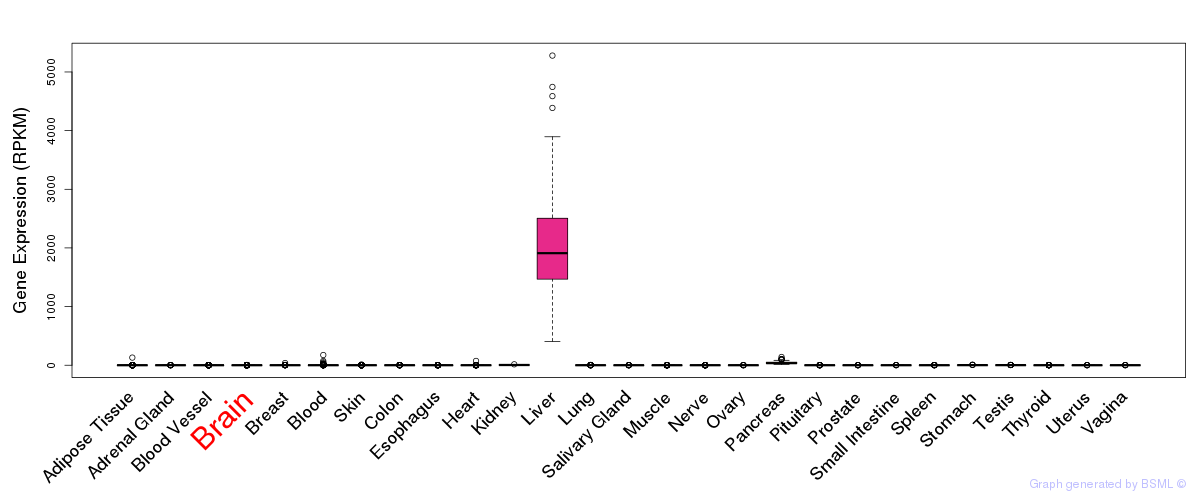
General gene expression (GTEx)
Gene expression during devlopment (BrainCloud)
Footnote:
A total of 269 time points ploted, with n=38 fetal samples (x=1:38). Each triangle represents one time point.
Gene expression of temporal and spatial changes (BrainSpan)
Footnote:
SC: sub-cortical regions; SM: sensory-motor regions; FC: frontal cortex; and TP: temporal-parietal cortex
ST1: fetal (13 - 26 postconception weeks), ST2: early infancy to late childhood (4 months to 11 years), and ST3: adolescence to adulthood (13 - 23 years)
The bar shown representes the lower 25% and upper 25% of the expression distribution.
Top co-expressed genes in brain regions
| Top 10 positively co-expressed genes | ||
| Gene | Pearson's Correlation | Spearman's Correlation |
| PIK3CB | 0.90 | 0.87 |
| SLC25A32 | 0.90 | 0.87 |
| FAM179B | 0.88 | 0.83 |
| NCKAP1 | 0.88 | 0.87 |
| ARL8B | 0.88 | 0.85 |
| RTN3 | 0.88 | 0.84 |
| TRIM37 | 0.87 | 0.85 |
| MTMR6 | 0.87 | 0.88 |
| SLC3A1 | 0.87 | 0.82 |
| TRIM23 | 0.87 | 0.85 |
| Top 10 negatively co-expressed genes | ||
| Gene | Pearson's Correlation | Spearman's Correlation |
| RAB34 | -0.54 | -0.61 |
| AF347015.21 | -0.54 | -0.40 |
| EFEMP2 | -0.53 | -0.59 |
| IL32 | -0.52 | -0.43 |
| AF347015.18 | -0.51 | -0.43 |
| EIF4EBP3 | -0.50 | -0.53 |
| BTBD17 | -0.50 | -0.63 |
| C1orf61 | -0.50 | -0.60 |
| C16orf74 | -0.49 | -0.53 |
| CLEC3B | -0.49 | -0.56 |
Section V. Pathway annotation
| Pathway name | Pathway size | # SZGR 2.0 genes in pathway | Info |
|---|---|---|---|
| MULLIGHAN NPM1 SIGNATURE 3 UP | 341 | 197 | All SZGR 2.0 genes in this pathway |
| MARTORIATI MDM4 TARGETS FETAL LIVER DN | 514 | 319 | All SZGR 2.0 genes in this pathway |
| RODWELL AGING KIDNEY NO BLOOD UP | 222 | 139 | All SZGR 2.0 genes in this pathway |
| RODWELL AGING KIDNEY UP | 487 | 303 | All SZGR 2.0 genes in this pathway |
| RIGGINS TAMOXIFEN RESISTANCE UP | 66 | 44 | All SZGR 2.0 genes in this pathway |
| ACEVEDO LIVER CANCER DN | 540 | 340 | All SZGR 2.0 genes in this pathway |
| BOCHKIS FOXA2 TARGETS | 425 | 261 | All SZGR 2.0 genes in this pathway |
| YOSHIMURA MAPK8 TARGETS UP | 1305 | 895 | All SZGR 2.0 genes in this pathway |
| WUNDER INFLAMMATORY RESPONSE AND CHOLESTEROL UP | 58 | 38 | All SZGR 2.0 genes in this pathway |
| CAIRO LIVER DEVELOPMENT DN | 222 | 141 | All SZGR 2.0 genes in this pathway |
| PILON KLF1 TARGETS UP | 504 | 321 | All SZGR 2.0 genes in this pathway |
| SERVITJA ISLET HNF1A TARGETS DN | 109 | 71 | All SZGR 2.0 genes in this pathway |
| NABA ECM REGULATORS | 238 | 125 | All SZGR 2.0 genes in this pathway |
| NABA MATRISOME ASSOCIATED | 753 | 411 | All SZGR 2.0 genes in this pathway |
| NABA MATRISOME | 1028 | 559 | All SZGR 2.0 genes in this pathway |