Gene Page: RTTN
Summary ?
| GeneID | 25914 |
| Symbol | RTTN |
| Synonyms | - |
| Description | rotatin |
| Reference | MIM:610436|HGNC:HGNC:18654|Ensembl:ENSG00000176225|HPRD:11525|Vega:OTTHUMG00000178694 |
| Gene type | protein-coding |
| Map location | 18q22.2 |
| Pascal p-value | 0.838 |
| Sherlock p-value | 0.614 |
| TADA p-value | 0.005 |
| Fetal beta | 0.878 |
| DMG | 1 (# studies) |
| eGene | Cerebellum |
Gene in Data Sources
| Gene set name | Method of gene set | Description | Info |
|---|---|---|---|
| CV:PGCnp | Genome-wide Association Study | GWAS | |
| DMG:Jaffe_2016 | Genome-wide DNA methylation analysis | This dataset includes 2,104 probes/CpGs associated with SZ patients (n=108) compared to 136 controls at Bonferroni-adjusted P < 0.05. | 1 |
| DNM:McCarthy_2014 | Whole Exome Sequencing analysis | Whole exome sequencing of 57 trios with sporadic or familial schizophrenia. |
Section I. Genetics and epigenetics annotation
 DNM table
| Gene | Chromosome | Position | Ref | Alt | Transcript | AA change | Mutation type | Sift | CG46 | Trait | Study |
|---|---|---|---|---|---|---|---|---|---|---|---|
| RTTN | chr18 | 67741212 | NM_173630 | p.1527_1528del | frameshift DEL | NA | NA | Schizophrenia | DNM:McCarthy_2014 |
Differentially methylated gene
| Probe | Chromosome | Position | Nearest gene | P (dis) | Beta (dis) | FDR (dis) | Study |
|---|---|---|---|---|---|---|---|
| cg06118578 | 18 | 67872897 | RTTN | 2.17E-8 | -0.011 | 7.32E-6 | DMG:Jaffe_2016 |
Section II. Transcriptome annotation
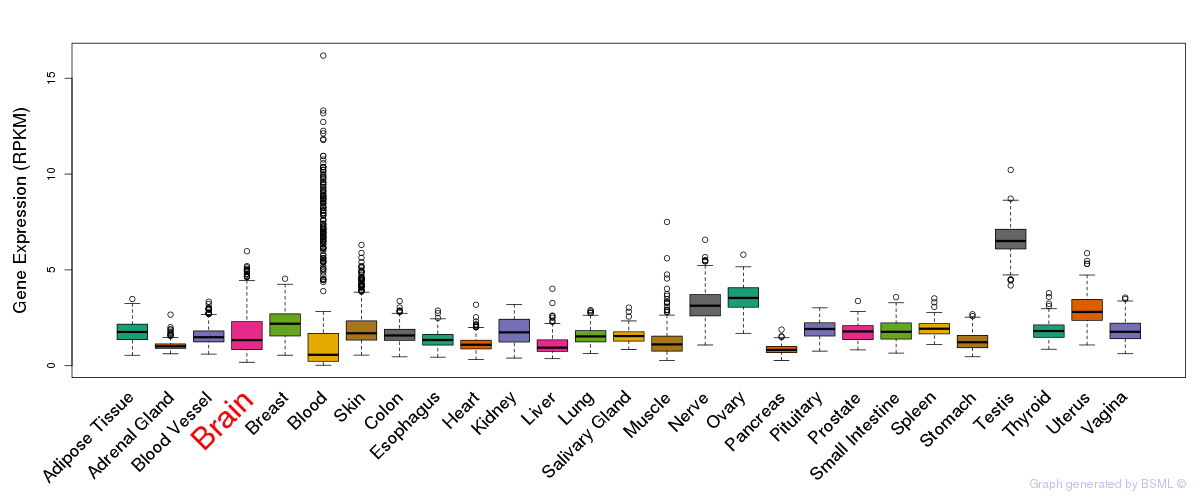
General gene expression (GTEx)
Gene expression during devlopment (BrainCloud)
Footnote:
A total of 269 time points ploted, with n=38 fetal samples (x=1:38). Each triangle represents one time point.
Gene expression of temporal and spatial changes (BrainSpan)
Footnote:
SC: sub-cortical regions; SM: sensory-motor regions; FC: frontal cortex; and TP: temporal-parietal cortex
ST1: fetal (13 - 26 postconception weeks), ST2: early infancy to late childhood (4 months to 11 years), and ST3: adolescence to adulthood (13 - 23 years)
The bar shown representes the lower 25% and upper 25% of the expression distribution.
No co-expressed genes in brain regions
Section V. Pathway annotation
| Pathway name | Pathway size | # SZGR 2.0 genes in pathway | Info |
|---|---|---|---|
| KINSEY TARGETS OF EWSR1 FLII FUSION UP | 1278 | 748 | All SZGR 2.0 genes in this pathway |
| GRAESSMANN APOPTOSIS BY DOXORUBICIN DN | 1781 | 1082 | All SZGR 2.0 genes in this pathway |
| CREIGHTON ENDOCRINE THERAPY RESISTANCE 3 | 720 | 440 | All SZGR 2.0 genes in this pathway |
| MARSON BOUND BY E2F4 UNSTIMULATED | 728 | 415 | All SZGR 2.0 genes in this pathway |
| BEIER GLIOMA STEM CELL UP | 39 | 17 | All SZGR 2.0 genes in this pathway |
| MEISSNER ES ICP WITH H3K4ME3 | 34 | 17 | All SZGR 2.0 genes in this pathway |
| MEISSNER NPC ICP WITH H3K4ME3 | 20 | 9 | All SZGR 2.0 genes in this pathway |
| MEISSNER BRAIN ICP WITH H3K4ME3 | 32 | 17 | All SZGR 2.0 genes in this pathway |
| MIKKELSEN ES ICP WITH H3K4ME3 | 718 | 401 | All SZGR 2.0 genes in this pathway |
| MIKKELSEN NPC ICP WITH H3K4ME3 | 445 | 257 | All SZGR 2.0 genes in this pathway |
| KOINUMA TARGETS OF SMAD2 OR SMAD3 | 824 | 528 | All SZGR 2.0 genes in this pathway |
| GOBERT OLIGODENDROCYTE DIFFERENTIATION DN | 1080 | 713 | All SZGR 2.0 genes in this pathway |
| WARTERS RESPONSE TO IR SKIN | 83 | 44 | All SZGR 2.0 genes in this pathway |