Gene Page: CHD5
Summary ?
| GeneID | 26038 |
| Symbol | CHD5 |
| Synonyms | CHD-5 |
| Description | chromodomain helicase DNA binding protein 5 |
| Reference | MIM:610771|HGNC:HGNC:16816|Ensembl:ENSG00000116254|HPRD:10828|Vega:OTTHUMG00000000952 |
| Gene type | protein-coding |
| Map location | 1p36.31 |
| Pascal p-value | 0.707 |
| Fetal beta | -2.238 |
| Support | CompositeSet Darnell FMRP targets |
Gene in Data Sources
| Gene set name | Method of gene set | Description | Info |
|---|---|---|---|
| CV:PGCnp | Genome-wide Association Study | GWAS | |
| DNM:Guipponi_2014 | Whole Exome Sequencing analysis | 49 DNMs were identified by comparing the exome of 53 individuals with sporadic SCZ and of their non-affected parents |
Section I. Genetics and epigenetics annotation
 DNM table
| Gene | Chromosome | Position | Ref | Alt | Transcript | AA change | Mutation type | Sift | CG46 | Trait | Study |
|---|---|---|---|---|---|---|---|---|---|---|---|
| CHD5 | G | A | NM_015557 | p.V1315M | missense | 0.07 | 0.92 | Schizophrenia | DNM:Guipponi_2014 |
Section II. Transcriptome annotation
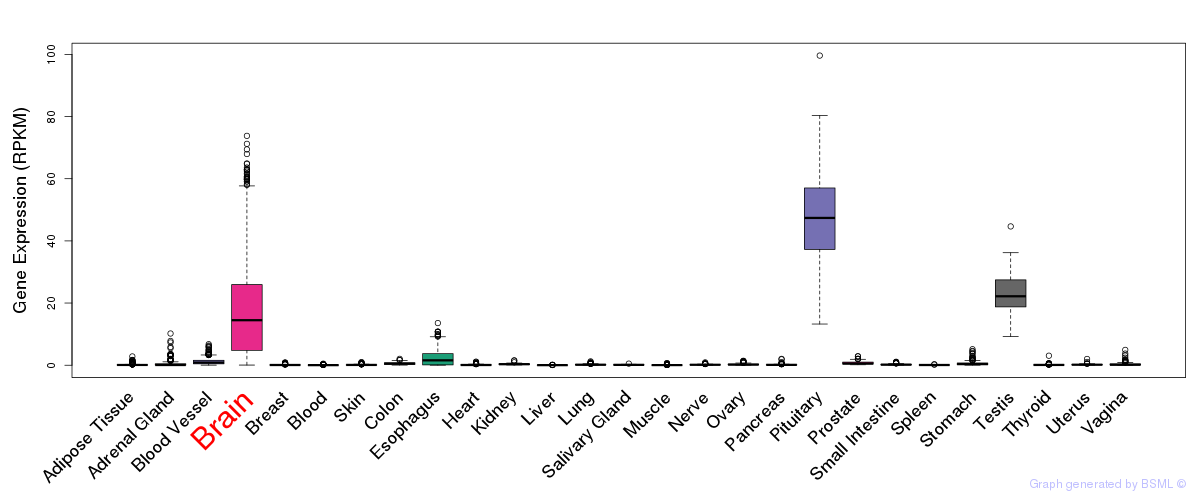
General gene expression (GTEx)
Gene expression during devlopment (BrainCloud)
Footnote:
A total of 269 time points ploted, with n=38 fetal samples (x=1:38). Each triangle represents one time point.
Gene expression of temporal and spatial changes (BrainSpan)
Footnote:
SC: sub-cortical regions; SM: sensory-motor regions; FC: frontal cortex; and TP: temporal-parietal cortex
ST1: fetal (13 - 26 postconception weeks), ST2: early infancy to late childhood (4 months to 11 years), and ST3: adolescence to adulthood (13 - 23 years)
The bar shown representes the lower 25% and upper 25% of the expression distribution.
Top co-expressed genes in brain regions
| Top 10 positively co-expressed genes | ||
| Gene | Pearson's Correlation | Spearman's Correlation |
| ZNF311 | 0.91 | 0.79 |
| MICAL1 | 0.90 | 0.82 |
| ANKZF1 | 0.90 | 0.81 |
| CNTROB | 0.90 | 0.79 |
| FAM48A | 0.90 | 0.81 |
| NVL | 0.89 | 0.81 |
| CLK2 | 0.89 | 0.80 |
| ZNF251 | 0.89 | 0.81 |
| ZNF509 | 0.89 | 0.83 |
| ANKRD10 | 0.89 | 0.82 |
| Top 10 negatively co-expressed genes | ||
| Gene | Pearson's Correlation | Spearman's Correlation |
| AIFM3 | -0.69 | -0.73 |
| HLA-F | -0.68 | -0.70 |
| C5orf53 | -0.68 | -0.74 |
| FBXO2 | -0.68 | -0.66 |
| ALDOC | -0.67 | -0.67 |
| PTH1R | -0.67 | -0.69 |
| ABCG2 | -0.66 | -0.68 |
| AF347015.27 | -0.65 | -0.78 |
| AF347015.31 | -0.65 | -0.77 |
| LDHD | -0.65 | -0.62 |
Section V. Pathway annotation
| Pathway name | Pathway size | # SZGR 2.0 genes in pathway | Info |
|---|---|---|---|
| LASTOWSKA NEUROBLASTOMA COPY NUMBER DN | 800 | 473 | All SZGR 2.0 genes in this pathway |
| WHITE NEUROBLASTOMA WITH 1P36.3 DELETION | 21 | 17 | All SZGR 2.0 genes in this pathway |
| OKAWA NEUROBLASTOMA 1P36 31 DELETION | 22 | 19 | All SZGR 2.0 genes in this pathway |
| LOPEZ MBD TARGETS | 957 | 597 | All SZGR 2.0 genes in this pathway |
| BENPORATH ES WITH H3K27ME3 | 1118 | 744 | All SZGR 2.0 genes in this pathway |
| SHEPARD CRUSH AND BURN MUTANT DN | 185 | 111 | All SZGR 2.0 genes in this pathway |
| IVANOVA HEMATOPOIESIS EARLY PROGENITOR | 532 | 309 | All SZGR 2.0 genes in this pathway |
| MEISSNER NPC HCP WITH H3K4ME2 | 491 | 319 | All SZGR 2.0 genes in this pathway |
| MIKKELSEN MCV6 HCP WITH H3K27ME3 | 435 | 318 | All SZGR 2.0 genes in this pathway |
| MIKKELSEN MEF HCP WITH H3K27ME3 | 590 | 403 | All SZGR 2.0 genes in this pathway |