Gene Page: CNNM3
Summary ?
| GeneID | 26505 |
| Symbol | CNNM3 |
| Synonyms | ACDP3 |
| Description | cyclin and CBS domain divalent metal cation transport mediator 3 |
| Reference | MIM:607804|HGNC:HGNC:104|HPRD:07419| |
| Gene type | protein-coding |
| Map location | 2p12-p11.2 |
| Pascal p-value | 0.002 |
| Sherlock p-value | 0.688 |
| DEG p-value | DEG:Zhao_2015:p=4.89e-05:q=0.0489 |
| Fetal beta | 0.847 |
| eGene | Myers' cis & trans |
| Support | CompositeSet |
Gene in Data Sources
| Gene set name | Method of gene set | Description | Info |
|---|---|---|---|
| CV:PGCnp | Genome-wide Association Study | GWAS | |
| DEG:Zhao_2015 | RNA Sequencing analysis | Transcriptome sequencing and genome-wide association analyses reveal lysosomal function and actin cytoskeleton remodeling in schizophrenia and bipolar disorder. | |
| DNM:Fromer_2014 | Whole Exome Sequencing analysis | This study reported a WES study of 623 schizophrenia trios, reporting DNMs using genomic DNA. | |
| GSMA_I | Genome scan meta-analysis | Psr: 0.0004 |
Section I. Genetics and epigenetics annotation
 DNM table
| Gene | Chromosome | Position | Ref | Alt | Transcript | AA change | Mutation type | Sift | CG46 | Trait | Study |
|---|---|---|---|---|---|---|---|---|---|---|---|
| CNNM3 | chr2 | 97493918 | C | A | NM_017623 NM_199078 | p.591T>N p.543T>N | missense missense | Schizophrenia | DNM:Fromer_2014 |
eQTL annotation
| SNP ID | Chromosome | Position | eGene | Gene Entrez ID | pvalue | qvalue | TSS distance | eQTL type |
|---|---|---|---|---|---|---|---|---|
| rs16829545 | chr2 | 151977407 | CNNM3 | 26505 | 4.359E-14 | trans | ||
| rs7584986 | chr2 | 184111432 | CNNM3 | 26505 | 3.929E-4 | trans | ||
| rs3106445 | chr3 | 165326464 | CNNM3 | 26505 | 0.16 | trans | ||
| rs520325 | chr3 | 165361016 | CNNM3 | 26505 | 0.11 | trans | ||
| rs2183142 | chr4 | 159232695 | CNNM3 | 26505 | 0.06 | trans | ||
| rs9993289 | chr4 | 160724785 | CNNM3 | 26505 | 0.03 | trans | ||
| rs4691618 | chr4 | 160749122 | CNNM3 | 26505 | 0 | trans | ||
| rs1031637 | chr4 | 160759123 | CNNM3 | 26505 | 0.03 | trans | ||
| rs897930 | chr4 | 160759355 | CNNM3 | 26505 | 0.03 | trans | ||
| rs4280696 | chr4 | 160762239 | CNNM3 | 26505 | 0.03 | trans | ||
| rs1457804 | chr4 | 160766410 | CNNM3 | 26505 | 0.03 | trans | ||
| rs2061337 | chr4 | 160768115 | CNNM3 | 26505 | 0.03 | trans | ||
| rs1379601 | chr4 | 160775476 | CNNM3 | 26505 | 0.03 | trans | ||
| snp_a-4218600 | 0 | CNNM3 | 26505 | 0.08 | trans | |||
| rs7787830 | chr7 | 98797019 | CNNM3 | 26505 | 0.03 | trans | ||
| rs3118341 | chr9 | 25185518 | CNNM3 | 26505 | 0.15 | trans | ||
| rs17176921 | chr10 | 50580874 | CNNM3 | 26505 | 0.07 | trans | ||
| rs2393316 | chr10 | 59333070 | CNNM3 | 26505 | 0.09 | trans | ||
| rs4265582 | chr11 | 18797649 | CNNM3 | 26505 | 0.08 | trans | ||
| rs16955618 | chr15 | 29937543 | CNNM3 | 26505 | 9.324E-13 | trans | ||
| rs1041786 | chr21 | 22617710 | CNNM3 | 26505 | 0.1 | trans |
Section II. Transcriptome annotation
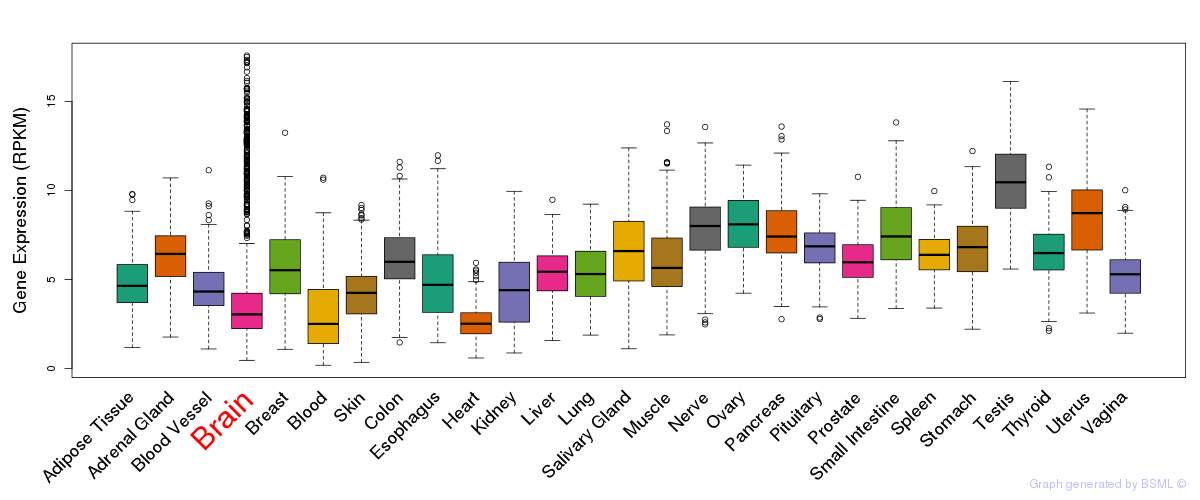
General gene expression (GTEx)
Gene expression during devlopment (BrainCloud)
Footnote:
A total of 269 time points ploted, with n=38 fetal samples (x=1:38). Each triangle represents one time point.
Gene expression of temporal and spatial changes (BrainSpan)
Footnote:
SC: sub-cortical regions; SM: sensory-motor regions; FC: frontal cortex; and TP: temporal-parietal cortex
ST1: fetal (13 - 26 postconception weeks), ST2: early infancy to late childhood (4 months to 11 years), and ST3: adolescence to adulthood (13 - 23 years)
The bar shown representes the lower 25% and upper 25% of the expression distribution.
No co-expressed genes in brain regions
Section III. Gene Ontology annotation
| Molecular function | GO term | Evidence | Neuro keywords | PubMed ID |
|---|---|---|---|---|
| GO:0005515 | protein binding | IPI | 17353931 | |
| Biological process | GO term | Evidence | Neuro keywords | PubMed ID |
| GO:0006811 | ion transport | IEA | - | |
| Cellular component | GO term | Evidence | Neuro keywords | PubMed ID |
| GO:0016021 | integral to membrane | IEA | - | |
| GO:0005886 | plasma membrane | IEA | - |
Section V. Pathway annotation
| Pathway name | Pathway size | # SZGR 2.0 genes in pathway | Info |
|---|---|---|---|
| PEREZ TP53 TARGETS | 1174 | 695 | All SZGR 2.0 genes in this pathway |
| WANG RESPONSE TO BEXAROTENE UP | 34 | 17 | All SZGR 2.0 genes in this pathway |
| ACEVEDO LIVER CANCER DN | 540 | 340 | All SZGR 2.0 genes in this pathway |
| ACEVEDO LIVER TUMOR VS NORMAL ADJACENT TISSUE DN | 274 | 165 | All SZGR 2.0 genes in this pathway |
| PILON KLF1 TARGETS DN | 1972 | 1213 | All SZGR 2.0 genes in this pathway |
| KASLER HDAC7 TARGETS 1 UP | 194 | 133 | All SZGR 2.0 genes in this pathway |
| FEVR CTNNB1 TARGETS DN | 553 | 343 | All SZGR 2.0 genes in this pathway |
Section VI. microRNA annotation
| miRNA family | Target position | miRNA ID | miRNA seq | ||
|---|---|---|---|---|---|
| UTR start | UTR end | Match method | |||
| miR-143 | 264 | 270 | m8 | hsa-miR-143brain | UGAGAUGAAGCACUGUAGCUCA |
| miR-182 | 568 | 574 | 1A | hsa-miR-182 | UUUGGCAAUGGUAGAACUCACA |
| miR-96 | 567 | 574 | 1A,m8 | hsa-miR-96brain | UUUGGCACUAGCACAUUUUUGC |
- SZ: miRNAs which differentially expressed in brain cortex of schizophrenia patients comparing with control samples using microarray. Click here to see the list of SZ related miRNAs.
- Brain: miRNAs which are expressed in brain based on miRNA microarray expression studies. Click here to see the list of brain related miRNAs.