Gene Page: RPS6KC1
Summary ?
| GeneID | 26750 |
| Symbol | RPS6KC1 |
| Synonyms | RPK118|RSKL1|S6K-delta-1|S6PKh1|humS6PKh1 |
| Description | ribosomal protein S6 kinase C1 |
| Reference | HGNC:HGNC:10439|Ensembl:ENSG00000136643|HPRD:10204| |
| Gene type | protein-coding |
| Map location | 1q41 |
| Sherlock p-value | 0.316 |
| Fetal beta | -0.416 |
Gene in Data Sources
| Gene set name | Method of gene set | Description | Info |
|---|---|---|---|
| CV:GWASdb | Genome-wide Association Studies | GWASdb records for schizophrenia | |
| CV:PGCnp | Genome-wide Association Study | GWAS |
Section I. Genetics and epigenetics annotation
Section II. Transcriptome annotation
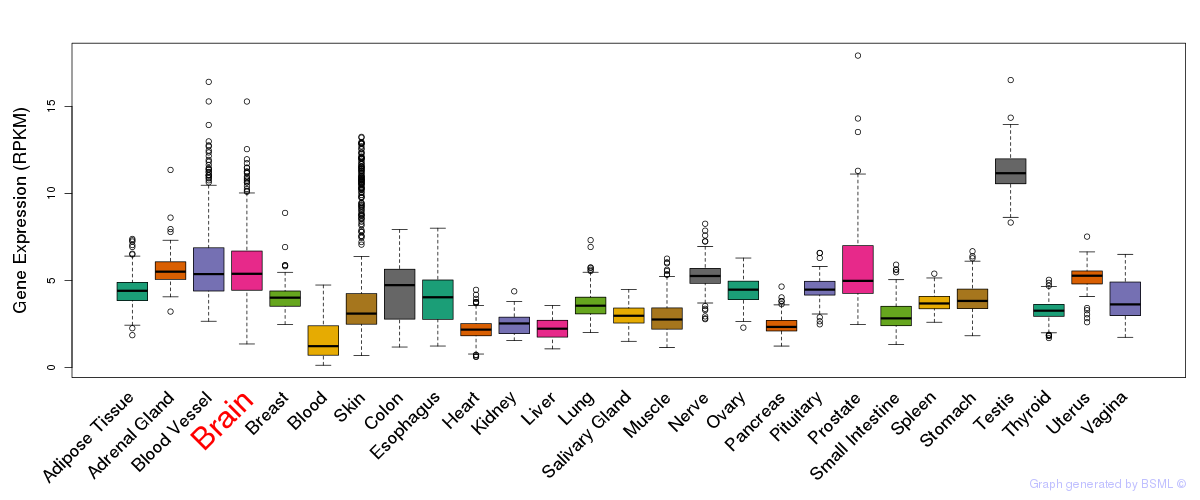
General gene expression (GTEx)

Gene expression during devlopment (BrainCloud)
Footnote:
A total of 269 time points ploted, with n=38 fetal samples (x=1:38). Each triangle represents one time point.
Gene expression of temporal and spatial changes (BrainSpan)
Footnote:
SC: sub-cortical regions; SM: sensory-motor regions; FC: frontal cortex; and TP: temporal-parietal cortex
ST1: fetal (13 - 26 postconception weeks), ST2: early infancy to late childhood (4 months to 11 years), and ST3: adolescence to adulthood (13 - 23 years)
The bar shown representes the lower 25% and upper 25% of the expression distribution.
Top co-expressed genes in brain regions
| Top 10 positively co-expressed genes | ||
| Gene | Pearson's Correlation | Spearman's Correlation |
| PCIF1 | 0.95 | 0.94 |
| SMPD4 | 0.94 | 0.94 |
| RBM14 | 0.94 | 0.94 |
| ZNF574 | 0.94 | 0.94 |
| MEN1 | 0.93 | 0.94 |
| EDC4 | 0.93 | 0.95 |
| TSC2 | 0.93 | 0.93 |
| TOR2A | 0.93 | 0.91 |
| ATP13A1 | 0.93 | 0.94 |
| CIZ1 | 0.93 | 0.92 |
| Top 10 negatively co-expressed genes | ||
| Gene | Pearson's Correlation | Spearman's Correlation |
| AF347015.27 | -0.74 | -0.85 |
| AF347015.31 | -0.73 | -0.85 |
| MT-CO2 | -0.73 | -0.85 |
| AF347015.8 | -0.71 | -0.85 |
| AF347015.33 | -0.70 | -0.81 |
| AF347015.21 | -0.70 | -0.91 |
| MT-CYB | -0.70 | -0.82 |
| C5orf53 | -0.67 | -0.72 |
| AF347015.15 | -0.67 | -0.81 |
| AF347015.2 | -0.65 | -0.80 |
Section V. Pathway annotation
| Pathway name | Pathway size | # SZGR 2.0 genes in pathway | Info |
|---|---|---|---|
| DIAZ CHRONIC MEYLOGENOUS LEUKEMIA UP | 1382 | 904 | All SZGR 2.0 genes in this pathway |
| OSMAN BLADDER CANCER UP | 404 | 246 | All SZGR 2.0 genes in this pathway |
| HAMAI APOPTOSIS VIA TRAIL UP | 584 | 356 | All SZGR 2.0 genes in this pathway |
| AMUNDSON RESPONSE TO ARSENITE | 217 | 143 | All SZGR 2.0 genes in this pathway |
| KIM MYCN AMPLIFICATION TARGETS DN | 103 | 59 | All SZGR 2.0 genes in this pathway |
| GROSS HIF1A TARGETS DN | 25 | 15 | All SZGR 2.0 genes in this pathway |
| GROSS HYPOXIA VIA ELK3 AND HIF1A UP | 142 | 104 | All SZGR 2.0 genes in this pathway |
| NUYTTEN NIPP1 TARGETS UP | 769 | 437 | All SZGR 2.0 genes in this pathway |
| NUYTTEN EZH2 TARGETS UP | 1037 | 673 | All SZGR 2.0 genes in this pathway |
| BUYTAERT PHOTODYNAMIC THERAPY STRESS UP | 811 | 508 | All SZGR 2.0 genes in this pathway |
| ALCALAY AML BY NPM1 LOCALIZATION UP | 140 | 83 | All SZGR 2.0 genes in this pathway |
| KUMAR TARGETS OF MLL AF9 FUSION | 405 | 264 | All SZGR 2.0 genes in this pathway |
| TRAYNOR RETT SYNDROM UP | 45 | 33 | All SZGR 2.0 genes in this pathway |
| KRIGE RESPONSE TO TOSEDOSTAT 6HR UP | 953 | 554 | All SZGR 2.0 genes in this pathway |
| KRIGE RESPONSE TO TOSEDOSTAT 24HR UP | 783 | 442 | All SZGR 2.0 genes in this pathway |
| MASSARWEH TAMOXIFEN RESISTANCE UP | 578 | 341 | All SZGR 2.0 genes in this pathway |
| PODAR RESPONSE TO ADAPHOSTIN UP | 147 | 98 | All SZGR 2.0 genes in this pathway |
| ICHIBA GRAFT VERSUS HOST DISEASE D7 UP | 107 | 67 | All SZGR 2.0 genes in this pathway |
| CHEN METABOLIC SYNDROM NETWORK | 1210 | 725 | All SZGR 2.0 genes in this pathway |
| CHEN LIVER METABOLISM QTL CIS | 93 | 40 | All SZGR 2.0 genes in this pathway |
| BOYAULT LIVER CANCER SUBCLASS G12 UP | 39 | 17 | All SZGR 2.0 genes in this pathway |
| COULOUARN TEMPORAL TGFB1 SIGNATURE UP | 109 | 68 | All SZGR 2.0 genes in this pathway |
| CAIRO HEPATOBLASTOMA UP | 207 | 143 | All SZGR 2.0 genes in this pathway |
| DUTERTRE ESTRADIOL RESPONSE 24HR DN | 505 | 328 | All SZGR 2.0 genes in this pathway |