Gene Page: SIGLEC7
Summary ?
| GeneID | 27036 |
| Symbol | SIGLEC7 |
| Synonyms | AIRM1|CD328|CDw328|D-siglec|QA79|SIGLEC-7|SIGLEC19P|SIGLECP2|p75|p75/AIRM1 |
| Description | sialic acid binding Ig like lectin 7 |
| Reference | MIM:604410|HGNC:HGNC:10876|Ensembl:ENSG00000168995|HPRD:05102|Vega:OTTHUMG00000182895 |
| Gene type | protein-coding |
| Map location | 19q13.3 |
| Pascal p-value | 0.304 |
| Fetal beta | -0.343 |
| DMG | 1 (# studies) |
Gene in Data Sources
| Gene set name | Method of gene set | Description | Info |
|---|---|---|---|
| CV:PGCnp | Genome-wide Association Study | GWAS | |
| DMG:vanEijk_2014 | Genome-wide DNA methylation analysis | This dataset includes 432 differentially methylated CpG sites corresponding to 391 unique transcripts between schizophrenia patients (n=260) and unaffected controls (n=250). | 2 |
Section I. Genetics and epigenetics annotation
 Differentially methylated gene
| Probe | Chromosome | Position | Nearest gene | P (dis) | Beta (dis) | FDR (dis) | Study |
|---|---|---|---|---|---|---|---|
| cg10129493 | 19 | 51728586 | SIGLEC7 | 0.001 | -3.161 | DMG:vanEijk_2014 | |
| cg17215680 | 19 | 51920976 | SIGLEC7 | 7.8E-5 | -5.063 | DMG:vanEijk_2014 |
Section II. Transcriptome annotation
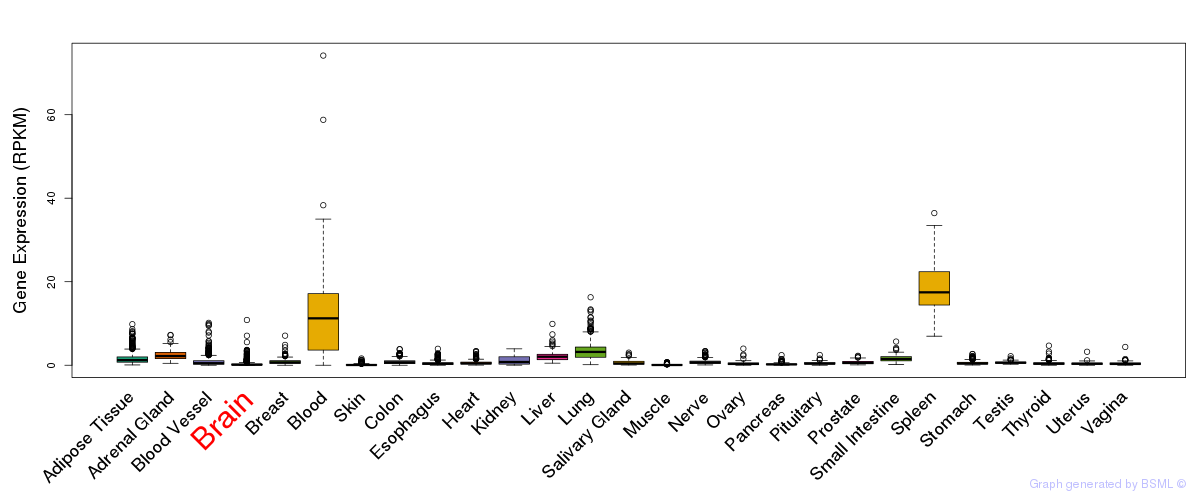
General gene expression (GTEx)
Gene expression during devlopment (BrainCloud)
Footnote:
A total of 269 time points ploted, with n=38 fetal samples (x=1:38). Each triangle represents one time point.
Gene expression of temporal and spatial changes (BrainSpan)
Footnote:
SC: sub-cortical regions; SM: sensory-motor regions; FC: frontal cortex; and TP: temporal-parietal cortex
ST1: fetal (13 - 26 postconception weeks), ST2: early infancy to late childhood (4 months to 11 years), and ST3: adolescence to adulthood (13 - 23 years)
The bar shown representes the lower 25% and upper 25% of the expression distribution.
Top co-expressed genes in brain regions
| Top 10 positively co-expressed genes | ||
| Gene | Pearson's Correlation | Spearman's Correlation |
| TTF1 | 0.93 | 0.95 |
| IWS1 | 0.93 | 0.94 |
| SF3B1 | 0.93 | 0.95 |
| MLH3 | 0.93 | 0.95 |
| RLF | 0.93 | 0.95 |
| CNOT2 | 0.93 | 0.93 |
| ZNF182 | 0.93 | 0.94 |
| HP1BP3 | 0.93 | 0.94 |
| ZNF615 | 0.93 | 0.95 |
| TOP1 | 0.93 | 0.94 |
| Top 10 negatively co-expressed genes | ||
| Gene | Pearson's Correlation | Spearman's Correlation |
| AF347015.31 | -0.78 | -0.89 |
| AF347015.27 | -0.77 | -0.86 |
| MT-CO2 | -0.77 | -0.88 |
| IFI27 | -0.77 | -0.88 |
| AIFM3 | -0.75 | -0.79 |
| FXYD1 | -0.75 | -0.86 |
| AF347015.33 | -0.74 | -0.84 |
| MT-CYB | -0.74 | -0.84 |
| AF347015.8 | -0.74 | -0.86 |
| TSC22D4 | -0.73 | -0.80 |
Section V. Pathway annotation
| Pathway name | Pathway size | # SZGR 2.0 genes in pathway | Info |
|---|---|---|---|
| PARENT MTOR SIGNALING DN | 46 | 29 | All SZGR 2.0 genes in this pathway |
| FULCHER INFLAMMATORY RESPONSE LECTIN VS LPS UP | 579 | 346 | All SZGR 2.0 genes in this pathway |
| PUJANA BRCA1 PCC NETWORK | 1652 | 1023 | All SZGR 2.0 genes in this pathway |
| LOPEZ MBD TARGETS | 957 | 597 | All SZGR 2.0 genes in this pathway |
| SHEN SMARCA2 TARGETS DN | 357 | 212 | All SZGR 2.0 genes in this pathway |
| BROWN MYELOID CELL DEVELOPMENT UP | 165 | 100 | All SZGR 2.0 genes in this pathway |
| MOREAUX MULTIPLE MYELOMA BY TACI UP | 412 | 249 | All SZGR 2.0 genes in this pathway |
| KONDO PROSTATE CANCER WITH H3K27ME3 | 196 | 93 | All SZGR 2.0 genes in this pathway |
| VALK AML CLUSTER 5 | 33 | 24 | All SZGR 2.0 genes in this pathway |
| SENGUPTA EBNA1 ANTICORRELATED | 173 | 85 | All SZGR 2.0 genes in this pathway |
| VERHAAK GLIOBLASTOMA MESENCHYMAL | 216 | 130 | All SZGR 2.0 genes in this pathway |