Gene Page: TRMT2A
Summary ?
| GeneID | 27037 |
| Symbol | TRMT2A |
| Synonyms | HTF9C |
| Description | tRNA methyltransferase 2 homolog A |
| Reference | MIM:611151|HGNC:HGNC:24974|Ensembl:ENSG00000099899|HPRD:13719|Vega:OTTHUMG00000150454 |
| Gene type | protein-coding |
| Map location | 22q11.21 |
| Pascal p-value | 5.986E-4 |
| Fetal beta | -0.349 |
Gene in Data Sources
| Gene set name | Method of gene set | Description | Info |
|---|---|---|---|
| CNV:YES | Copy number variation studies | Manual curation | |
| CV:PGCnp | Genome-wide Association Study | GWAS | |
| Association | A combined odds ratio method (Sun et al. 2008), association studies | 2 | Link to SZGene |
Section I. Genetics and epigenetics annotation
Section II. Transcriptome annotation
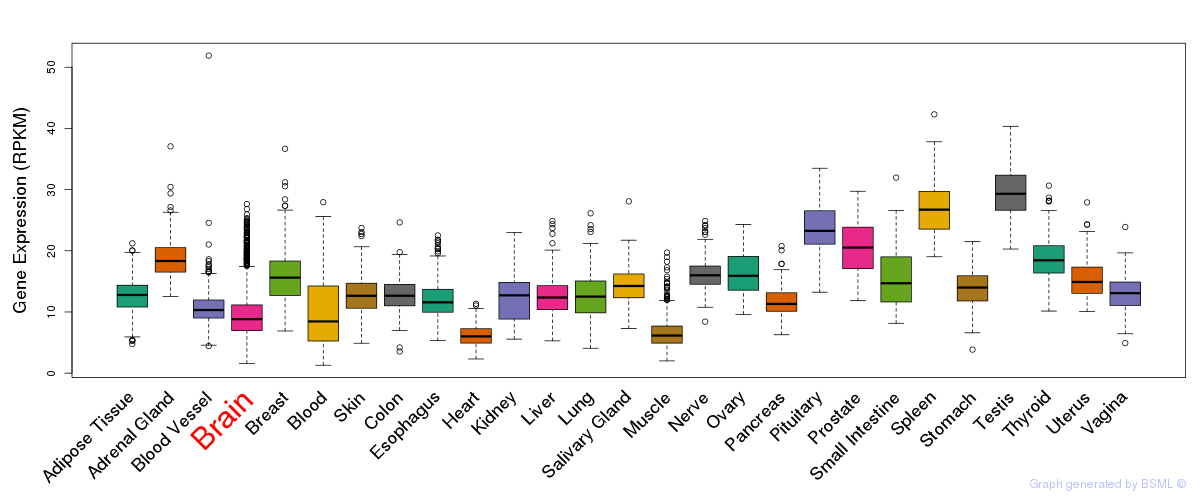
General gene expression (GTEx)
Gene expression during devlopment (BrainCloud)
Footnote:
A total of 269 time points ploted, with n=38 fetal samples (x=1:38). Each triangle represents one time point.
Gene expression of temporal and spatial changes (BrainSpan)
Footnote:
SC: sub-cortical regions; SM: sensory-motor regions; FC: frontal cortex; and TP: temporal-parietal cortex
ST1: fetal (13 - 26 postconception weeks), ST2: early infancy to late childhood (4 months to 11 years), and ST3: adolescence to adulthood (13 - 23 years)
The bar shown representes the lower 25% and upper 25% of the expression distribution.
Top co-expressed genes in brain regions
| Top 10 positively co-expressed genes | ||
| Gene | Pearson's Correlation | Spearman's Correlation |
| C17orf42 | 0.80 | 0.86 |
| CYP2R1 | 0.79 | 0.86 |
| GLT8D1 | 0.79 | 0.85 |
| C4orf27 | 0.78 | 0.86 |
| COQ3 | 0.78 | 0.84 |
| NAE1 | 0.78 | 0.85 |
| C7orf36 | 0.78 | 0.87 |
| TRNAU1AP | 0.78 | 0.84 |
| FRG1 | 0.77 | 0.83 |
| ACAT1 | 0.77 | 0.84 |
| Top 10 negatively co-expressed genes | ||
| Gene | Pearson's Correlation | Spearman's Correlation |
| AF347015.15 | -0.67 | -0.74 |
| AF347015.2 | -0.67 | -0.75 |
| MT-CO2 | -0.67 | -0.70 |
| MT-CYB | -0.66 | -0.72 |
| AF347015.8 | -0.66 | -0.72 |
| AF347015.26 | -0.66 | -0.76 |
| AF347015.27 | -0.66 | -0.70 |
| AF347015.33 | -0.64 | -0.69 |
| AF347015.31 | -0.62 | -0.68 |
| AIFM3 | -0.61 | -0.65 |
Section III. Gene Ontology annotation
| Molecular function | GO term | Evidence | Neuro keywords | PubMed ID |
|---|---|---|---|---|
| GO:0000166 | nucleotide binding | IEA | - | |
| GO:0003723 | RNA binding | IEA | - | |
| GO:0008168 | methyltransferase activity | IEA | - | |
| Biological process | GO term | Evidence | Neuro keywords | PubMed ID |
| GO:0008152 | metabolic process | IEA | - | |
| Cellular component | GO term | Evidence | Neuro keywords | PubMed ID |
| GO:0005634 | nucleus | IDA | 18029348 | |
| GO:0005737 | cytoplasm | IDA | 18029348 |
Section V. Pathway annotation
| Pathway name | Pathway size | # SZGR 2.0 genes in pathway | Info |
|---|---|---|---|
| BENPORATH CYCLING GENES | 648 | 385 | All SZGR 2.0 genes in this pathway |
| STARK PREFRONTAL CORTEX 22Q11 DELETION DN | 517 | 309 | All SZGR 2.0 genes in this pathway |
| STARK HYPPOCAMPUS 22Q11 DELETION DN | 20 | 19 | All SZGR 2.0 genes in this pathway |
| HESS TARGETS OF HOXA9 AND MEIS1 UP | 65 | 44 | All SZGR 2.0 genes in this pathway |
| MARSON BOUND BY E2F4 UNSTIMULATED | 728 | 415 | All SZGR 2.0 genes in this pathway |
| BONOME OVARIAN CANCER SURVIVAL SUBOPTIMAL DEBULKING | 510 | 309 | All SZGR 2.0 genes in this pathway |
| WHITFIELD CELL CYCLE G2 | 182 | 102 | All SZGR 2.0 genes in this pathway |
| PILON KLF1 TARGETS DN | 1972 | 1213 | All SZGR 2.0 genes in this pathway |