Gene Page: CACYBP
Summary ?
| GeneID | 27101 |
| Symbol | CACYBP |
| Synonyms | GIG5|PNAS-107|S100A6BP|SIP |
| Description | calcyclin binding protein |
| Reference | MIM:606186|HGNC:HGNC:30423|Ensembl:ENSG00000116161|HPRD:07316|Vega:OTTHUMG00000034941 |
| Gene type | protein-coding |
| Map location | 1q24-q25 |
| Fetal beta | -1.208 |
| DMG | 1 (# studies) |
| eGene | Myers' cis & trans |
| Support | CompositeSet |
Gene in Data Sources
| Gene set name | Method of gene set | Description | Info |
|---|---|---|---|
| CV:PGCnp | Genome-wide Association Study | GWAS | |
| DMG:Jaffe_2016 | Genome-wide DNA methylation analysis | This dataset includes 2,104 probes/CpGs associated with SZ patients (n=108) compared to 136 controls at Bonferroni-adjusted P < 0.05. | 1 |
| Network | Shortest path distance of core genes in the Human protein-protein interaction network | Contribution to shortest path in PPI network: 0.0044 |
Section I. Genetics and epigenetics annotation
 Differentially methylated gene
| Probe | Chromosome | Position | Nearest gene | P (dis) | Beta (dis) | FDR (dis) | Study |
|---|---|---|---|---|---|---|---|
| cg04488215 | 1 | 174968829 | CACYBP | 8.16E-9 | -0.009 | 3.87E-6 | DMG:Jaffe_2016 |
eQTL annotation
| SNP ID | Chromosome | Position | eGene | Gene Entrez ID | pvalue | qvalue | TSS distance | eQTL type |
|---|---|---|---|---|---|---|---|---|
| rs4650945 | chr1 | 174084103 | CACYBP | 27101 | 0.15 | cis | ||
| rs10912753 | chr1 | 174234363 | CACYBP | 27101 | 0.07 | cis | ||
| rs6678209 | chr1 | 174294744 | CACYBP | 27101 | 0.03 | cis | ||
| rs2860955 | chr1 | 174360517 | CACYBP | 27101 | 0.09 | cis | ||
| rs12076548 | chr1 | 174448142 | CACYBP | 27101 | 0.06 | cis | ||
| rs1474575 | chr1 | 174538700 | CACYBP | 27101 | 0.06 | cis | ||
| rs10912821 | chr1 | 174592810 | CACYBP | 27101 | 0.04 | cis | ||
| rs11804941 | chr1 | 174593211 | CACYBP | 27101 | 0.08 | cis | ||
| rs10912824 | chr1 | 174594983 | CACYBP | 27101 | 0.1 | cis | ||
| rs333422 | chr1 | 174633304 | CACYBP | 27101 | 0.02 | cis | ||
| rs10494492 | chr1 | 174692636 | CACYBP | 27101 | 0.02 | cis | ||
| rs2760057 | chr1 | 174712521 | CACYBP | 27101 | 0.05 | cis | ||
| rs1793319 | chr1 | 174764607 | CACYBP | 27101 | 0.09 | cis | ||
| rs1793320 | chr1 | 174765445 | CACYBP | 27101 | 0.04 | cis | ||
| rs1613634 | chr1 | 174772321 | CACYBP | 27101 | 0.02 | cis | ||
| rs3118990 | chr1 | 174787723 | CACYBP | 27101 | 0.04 | cis | ||
| rs1793316 | chr1 | 174794143 | CACYBP | 27101 | 0.05 | cis | ||
| rs1754352 | chr1 | 174805121 | CACYBP | 27101 | 0.04 | cis | ||
| rs12078839 | chr1 | 174861486 | CACYBP | 27101 | 0.02 | cis | ||
| rs17302033 | chr1 | 174897194 | CACYBP | 27101 | 0.03 | cis | ||
| rs10912853 | chr1 | 174898451 | CACYBP | 27101 | 0.04 | cis | ||
| rs10912854 | chr1 | 174898714 | CACYBP | 27101 | 0.09 | cis |
Section II. Transcriptome annotation
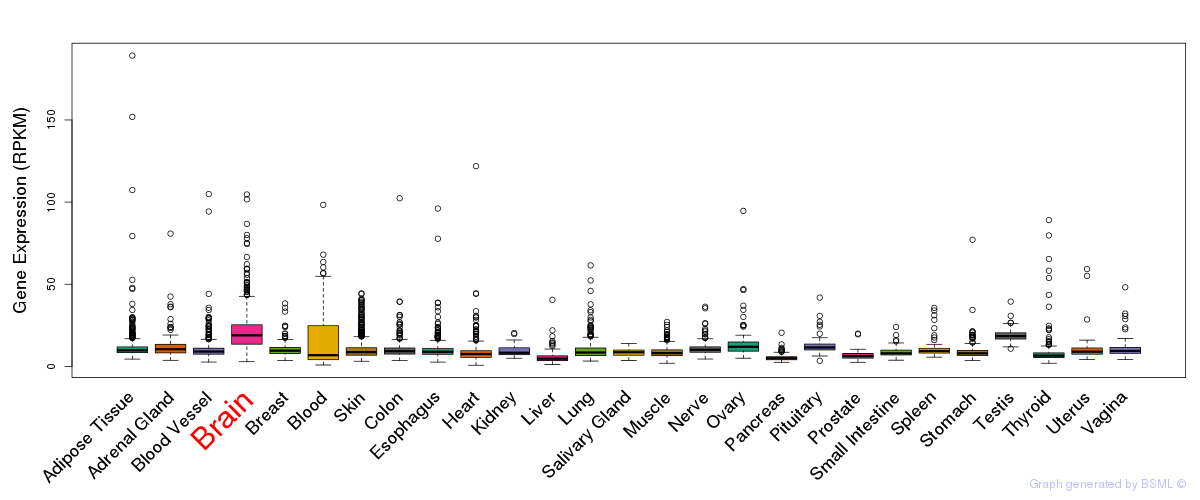
General gene expression (GTEx)
Gene expression during devlopment (BrainCloud)
Footnote:
A total of 269 time points ploted, with n=38 fetal samples (x=1:38). Each triangle represents one time point.
Gene expression of temporal and spatial changes (BrainSpan)
Footnote:
SC: sub-cortical regions; SM: sensory-motor regions; FC: frontal cortex; and TP: temporal-parietal cortex
ST1: fetal (13 - 26 postconception weeks), ST2: early infancy to late childhood (4 months to 11 years), and ST3: adolescence to adulthood (13 - 23 years)
The bar shown representes the lower 25% and upper 25% of the expression distribution.
No co-expressed genes in brain regions
Section III. Gene Ontology annotation
| Molecular function | GO term | Evidence | Neuro keywords | PubMed ID |
|---|---|---|---|---|
| GO:0005515 | protein binding | IPI | 17353931 | |
| Biological process | GO term | Evidence | Neuro keywords | PubMed ID |
| GO:0006511 | ubiquitin-dependent protein catabolic process | IEA | - | |
| Cellular component | GO term | Evidence | Neuro keywords | PubMed ID |
| GO:0005634 | nucleus | IEA | - | |
| GO:0005641 | nuclear envelope lumen | IEA | - | |
| GO:0005737 | cytoplasm | IEA | - |
Section V. Pathway annotation
| Pathway name | Pathway size | # SZGR 2.0 genes in pathway | Info |
|---|---|---|---|
| KEGG WNT SIGNALING PATHWAY | 151 | 112 | All SZGR 2.0 genes in this pathway |
| DIAZ CHRONIC MEYLOGENOUS LEUKEMIA UP | 1382 | 904 | All SZGR 2.0 genes in this pathway |
| CHARAFE BREAST CANCER LUMINAL VS BASAL UP | 380 | 215 | All SZGR 2.0 genes in this pathway |
| GAL LEUKEMIC STEM CELL UP | 133 | 78 | All SZGR 2.0 genes in this pathway |
| BASAKI YBX1 TARGETS UP | 290 | 177 | All SZGR 2.0 genes in this pathway |
| OSWALD HEMATOPOIETIC STEM CELL IN COLLAGEN GEL DN | 275 | 168 | All SZGR 2.0 genes in this pathway |
| RHEIN ALL GLUCOCORTICOID THERAPY DN | 362 | 238 | All SZGR 2.0 genes in this pathway |
| TIEN INTESTINE PROBIOTICS 24HR UP | 557 | 331 | All SZGR 2.0 genes in this pathway |
| KINSEY TARGETS OF EWSR1 FLII FUSION UP | 1278 | 748 | All SZGR 2.0 genes in this pathway |
| DODD NASOPHARYNGEAL CARCINOMA DN | 1375 | 806 | All SZGR 2.0 genes in this pathway |
| RODRIGUES THYROID CARCINOMA POORLY DIFFERENTIATED UP | 633 | 376 | All SZGR 2.0 genes in this pathway |
| HAHTOLA MYCOSIS FUNGOIDES CD4 DN | 116 | 71 | All SZGR 2.0 genes in this pathway |
| BERENJENO TRANSFORMED BY RHOA UP | 536 | 340 | All SZGR 2.0 genes in this pathway |
| DARWICHE SKIN TUMOR PROMOTER DN | 185 | 115 | All SZGR 2.0 genes in this pathway |
| DARWICHE PAPILLOMA RISK LOW UP | 162 | 104 | All SZGR 2.0 genes in this pathway |
| DARWICHE PAPILLOMA RISK HIGH UP | 147 | 101 | All SZGR 2.0 genes in this pathway |
| DARWICHE SQUAMOUS CELL CARCINOMA UP | 146 | 104 | All SZGR 2.0 genes in this pathway |
| SCHLOSSER SERUM RESPONSE DN | 712 | 443 | All SZGR 2.0 genes in this pathway |
| YORDY RECIPROCAL REGULATION BY ETS1 AND SP100 DN | 87 | 48 | All SZGR 2.0 genes in this pathway |
| SPIELMAN LYMPHOBLAST EUROPEAN VS ASIAN UP | 479 | 299 | All SZGR 2.0 genes in this pathway |
| GROSS HYPOXIA VIA HIF1A UP | 77 | 49 | All SZGR 2.0 genes in this pathway |
| GROSS HYPOXIA VIA ELK3 AND HIF1A DN | 103 | 71 | All SZGR 2.0 genes in this pathway |
| WEI MYCN TARGETS WITH E BOX | 795 | 478 | All SZGR 2.0 genes in this pathway |
| RICKMAN TUMOR DIFFERENTIATED WELL VS POORLY UP | 236 | 139 | All SZGR 2.0 genes in this pathway |
| BENPORATH MYC MAX TARGETS | 775 | 494 | All SZGR 2.0 genes in this pathway |
| STARK PREFRONTAL CORTEX 22Q11 DELETION DN | 517 | 309 | All SZGR 2.0 genes in this pathway |
| GOLDRATH HOMEOSTATIC PROLIFERATION | 171 | 102 | All SZGR 2.0 genes in this pathway |
| IGLESIAS E2F TARGETS UP | 151 | 103 | All SZGR 2.0 genes in this pathway |
| BLALOCK ALZHEIMERS DISEASE DN | 1237 | 837 | All SZGR 2.0 genes in this pathway |
| WANG SMARCE1 TARGETS DN | 371 | 218 | All SZGR 2.0 genes in this pathway |
| BLALOCK ALZHEIMERS DISEASE INCIPIENT DN | 165 | 106 | All SZGR 2.0 genes in this pathway |
| CHNG MULTIPLE MYELOMA HYPERPLOID DN | 28 | 19 | All SZGR 2.0 genes in this pathway |
| WANG TUMOR INVASIVENESS DN | 210 | 128 | All SZGR 2.0 genes in this pathway |
| TOOKER GEMCITABINE RESISTANCE DN | 122 | 84 | All SZGR 2.0 genes in this pathway |
| MILI PSEUDOPODIA HAPTOTAXIS UP | 518 | 299 | All SZGR 2.0 genes in this pathway |
| BOYAULT LIVER CANCER SUBCLASS G123 UP | 45 | 21 | All SZGR 2.0 genes in this pathway |
| WINNEPENNINCKX MELANOMA METASTASIS UP | 162 | 86 | All SZGR 2.0 genes in this pathway |
| DANG BOUND BY MYC | 1103 | 714 | All SZGR 2.0 genes in this pathway |
| YAO TEMPORAL RESPONSE TO PROGESTERONE CLUSTER 10 | 69 | 38 | All SZGR 2.0 genes in this pathway |
| KARLSSON TGFB1 TARGETS UP | 127 | 78 | All SZGR 2.0 genes in this pathway |
| MARTENS TRETINOIN RESPONSE DN | 841 | 431 | All SZGR 2.0 genes in this pathway |
| CHICAS RB1 TARGETS SENESCENT | 572 | 352 | All SZGR 2.0 genes in this pathway |
| CHICAS RB1 TARGETS GROWING | 243 | 155 | All SZGR 2.0 genes in this pathway |
| LEE BMP2 TARGETS DN | 882 | 538 | All SZGR 2.0 genes in this pathway |
| GUO TARGETS OF IRS1 AND IRS2 | 98 | 67 | All SZGR 2.0 genes in this pathway |
| RAO BOUND BY SALL4 | 227 | 149 | All SZGR 2.0 genes in this pathway |
| ZHOU CELL CYCLE GENES IN IR RESPONSE 24HR | 128 | 73 | All SZGR 2.0 genes in this pathway |