Gene Page: SLC39A1
Summary ?
| GeneID | 27173 |
| Symbol | SLC39A1 |
| Synonyms | ZIP1|ZIRTL |
| Description | solute carrier family 39 member 1 |
| Reference | MIM:604740|HGNC:HGNC:12876|Ensembl:ENSG00000143570|HPRD:11984|Vega:OTTHUMG00000037158 |
| Gene type | protein-coding |
| Map location | 1q21 |
| Sherlock p-value | 0.383 |
| Fetal beta | -0.022 |
| DMG | 1 (# studies) |
| eGene | Myers' cis & trans |
Gene in Data Sources
| Gene set name | Method of gene set | Description | Info |
|---|---|---|---|
| CV:PGCnp | Genome-wide Association Study | GWAS | |
| DMG:Jaffe_2016 | Genome-wide DNA methylation analysis | This dataset includes 2,104 probes/CpGs associated with SZ patients (n=108) compared to 136 controls at Bonferroni-adjusted P < 0.05. | 1 |
| GSMA_I | Genome scan meta-analysis | Psr: 0.0235 | |
| GSMA_IIA | Genome scan meta-analysis (All samples) | Psr: 0.00814 |
Section I. Genetics and epigenetics annotation
 Differentially methylated gene
| Probe | Chromosome | Position | Nearest gene | P (dis) | Beta (dis) | FDR (dis) | Study |
|---|---|---|---|---|---|---|---|
| cg14747580 | 1 | 153936275 | SLC39A1 | 2.15E-8 | -0.006 | 7.29E-6 | DMG:Jaffe_2016 |
eQTL annotation
| SNP ID | Chromosome | Position | eGene | Gene Entrez ID | pvalue | qvalue | TSS distance | eQTL type |
|---|---|---|---|---|---|---|---|---|
| rs4501739 | chrX | 35960848 | SLC39A1 | 27173 | 0.14 | trans |
Section II. Transcriptome annotation
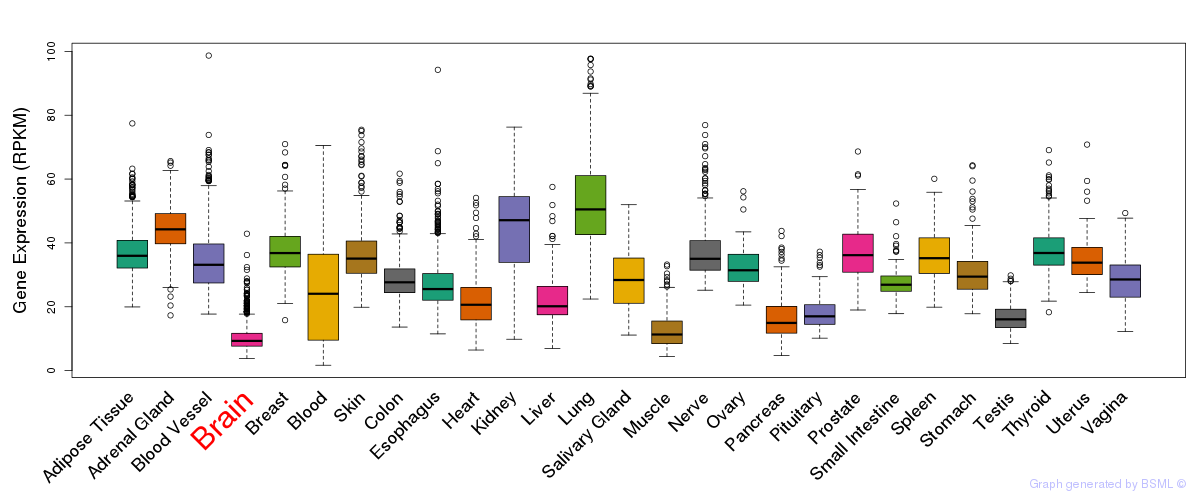
General gene expression (GTEx)
Gene expression during devlopment (BrainCloud)
Footnote:
A total of 269 time points ploted, with n=38 fetal samples (x=1:38). Each triangle represents one time point.
Gene expression of temporal and spatial changes (BrainSpan)
Footnote:
SC: sub-cortical regions; SM: sensory-motor regions; FC: frontal cortex; and TP: temporal-parietal cortex
ST1: fetal (13 - 26 postconception weeks), ST2: early infancy to late childhood (4 months to 11 years), and ST3: adolescence to adulthood (13 - 23 years)
The bar shown representes the lower 25% and upper 25% of the expression distribution.
Top co-expressed genes in brain regions
| Top 10 positively co-expressed genes | ||
| Gene | Pearson's Correlation | Spearman's Correlation |
| UNC119 | 0.92 | 0.91 |
| TBCB | 0.91 | 0.91 |
| EBP | 0.90 | 0.91 |
| DALRD3 | 0.90 | 0.91 |
| RNF25 | 0.90 | 0.91 |
| DGUOK | 0.89 | 0.89 |
| FNDC4 | 0.89 | 0.91 |
| ITPA | 0.89 | 0.91 |
| STK19 | 0.89 | 0.91 |
| EMD | 0.89 | 0.88 |
| Top 10 negatively co-expressed genes | ||
| Gene | Pearson's Correlation | Spearman's Correlation |
| AF347015.8 | -0.74 | -0.77 |
| AF347015.27 | -0.73 | -0.76 |
| AF347015.26 | -0.72 | -0.80 |
| MT-CYB | -0.72 | -0.77 |
| AF347015.33 | -0.72 | -0.76 |
| MT-CO2 | -0.72 | -0.73 |
| AF347015.15 | -0.71 | -0.77 |
| AF347015.2 | -0.71 | -0.78 |
| AF347015.31 | -0.69 | -0.72 |
| MT-ATP8 | -0.66 | -0.79 |
Section III. Gene Ontology annotation
| Molecular function | GO term | Evidence | Neuro keywords | PubMed ID |
|---|---|---|---|---|
| GO:0005385 | zinc ion transmembrane transporter activity | IEA | - | |
| GO:0008270 | zinc ion binding | IEA | - | |
| GO:0046873 | metal ion transmembrane transporter activity | IEA | - | |
| Biological process | GO term | Evidence | Neuro keywords | PubMed ID |
| GO:0030001 | metal ion transport | IEA | - | |
| GO:0006829 | zinc ion transport | IEA | - | |
| GO:0006811 | ion transport | IEA | - | |
| GO:0015674 | di-, tri-valent inorganic cation transport | TAS | 10610721 | |
| Cellular component | GO term | Evidence | Neuro keywords | PubMed ID |
| GO:0005789 | endoplasmic reticulum membrane | IEA | - | |
| GO:0005624 | membrane fraction | TAS | 10610721 | |
| GO:0005783 | endoplasmic reticulum | IEA | - | |
| GO:0016020 | membrane | IEA | - | |
| GO:0016021 | integral to membrane | TAS | 10610721 | |
| GO:0005886 | plasma membrane | IEA | - |
Section V. Pathway annotation
| Pathway name | Pathway size | # SZGR 2.0 genes in pathway | Info |
|---|---|---|---|
| REACTOME TRANSMEMBRANE TRANSPORT OF SMALL MOLECULES | 413 | 270 | All SZGR 2.0 genes in this pathway |
| REACTOME SLC MEDIATED TRANSMEMBRANE TRANSPORT | 241 | 157 | All SZGR 2.0 genes in this pathway |
| REACTOME TRANSPORT OF GLUCOSE AND OTHER SUGARS BILE SALTS AND ORGANIC ACIDS METAL IONS AND AMINE COMPOUNDS | 89 | 54 | All SZGR 2.0 genes in this pathway |
| REACTOME ZINC TRANSPORTERS | 15 | 9 | All SZGR 2.0 genes in this pathway |
| REACTOME METAL ION SLC TRANSPORTERS | 22 | 13 | All SZGR 2.0 genes in this pathway |
| MULLIGHAN NPM1 MUTATED SIGNATURE 1 UP | 276 | 165 | All SZGR 2.0 genes in this pathway |
| MULLIGHAN NPM1 MUTATED SIGNATURE 2 UP | 139 | 83 | All SZGR 2.0 genes in this pathway |
| MULLIGHAN NPM1 SIGNATURE 3 UP | 341 | 197 | All SZGR 2.0 genes in this pathway |
| PATIL LIVER CANCER | 747 | 453 | All SZGR 2.0 genes in this pathway |
| LOCKWOOD AMPLIFIED IN LUNG CANCER | 214 | 139 | All SZGR 2.0 genes in this pathway |
| BENPORATH SOX2 TARGETS | 734 | 436 | All SZGR 2.0 genes in this pathway |
| GEORGES TARGETS OF MIR192 AND MIR215 | 893 | 528 | All SZGR 2.0 genes in this pathway |
| ZHOU TNF SIGNALING 30MIN | 54 | 36 | All SZGR 2.0 genes in this pathway |
| MARSON BOUND BY FOXP3 UNSTIMULATED | 1229 | 713 | All SZGR 2.0 genes in this pathway |
| RIZKI TUMOR INVASIVENESS 3D UP | 210 | 124 | All SZGR 2.0 genes in this pathway |
| MCCABE BOUND BY HOXC6 | 469 | 239 | All SZGR 2.0 genes in this pathway |
| ACEVEDO LIVER TUMOR VS NORMAL ADJACENT TISSUE UP | 863 | 514 | All SZGR 2.0 genes in this pathway |
| KRIEG HYPOXIA NOT VIA KDM3A | 770 | 480 | All SZGR 2.0 genes in this pathway |
Section VI. microRNA annotation
| miRNA family | Target position | miRNA ID | miRNA seq | ||
|---|---|---|---|---|---|
| UTR start | UTR end | Match method | |||
| miR-182 | 815 | 821 | 1A | hsa-miR-182 | UUUGGCAAUGGUAGAACUCACA |
| hsa-miR-182 | UUUGGCAAUGGUAGAACUCACA | ||||
| miR-218 | 605 | 611 | m8 | hsa-miR-218brain | UUGUGCUUGAUCUAACCAUGU |
| miR-223 | 939 | 945 | m8 | hsa-miR-223 | UGUCAGUUUGUCAAAUACCCC |
| miR-96 | 575 | 582 | 1A,m8 | hsa-miR-96brain | UUUGGCACUAGCACAUUUUUGC |
| hsa-miR-96brain | UUUGGCACUAGCACAUUUUUGC | ||||
- SZ: miRNAs which differentially expressed in brain cortex of schizophrenia patients comparing with control samples using microarray. Click here to see the list of SZ related miRNAs.
- Brain: miRNAs which are expressed in brain based on miRNA microarray expression studies. Click here to see the list of brain related miRNAs.