Gene Page: ABO
Summary ?
| GeneID | 28 |
| Symbol | ABO |
| Synonyms | A3GALNT|A3GALT1|GTB|NAGAT |
| Description | ABO blood group (transferase A, alpha 1-3-N-acetylgalactosaminyltransferase; transferase B, alpha 1-3-galactosyltransferase) |
| Reference | MIM:110300|HGNC:HGNC:79|Ensembl:ENSG00000175164|HPRD:05821| |
| Gene type | protein-coding |
| Map location | 9q34.2 |
| Pascal p-value | 0.493 |
| Fetal beta | -0.168 |
| DMG | 1 (# studies) |
| eGene | Meta |
Gene in Data Sources
| Gene set name | Method of gene set | Description | Info |
|---|---|---|---|
| CV:PGCnp | Genome-wide Association Study | GWAS | |
| DMG:Wockner_2014 | Genome-wide DNA methylation analysis | This dataset includes 4641 differentially methylated probes corresponding to 2929 unique genes between schizophrenia patients (n=24) and controls (n=24). | 1 |
| PMID:cooccur | High-throughput literature-search | Systematic search in PubMed for genes co-occurring with SCZ keywords. A total of 3027 genes were included. | |
| Literature | High-throughput literature-search | Co-occurance with Schizophrenia keywords: schizophrenia,schizophrenic,schizophrenics,schizophrenias,schizotypal | Click to show details |
Section I. Genetics and epigenetics annotation
 Differentially methylated gene
| Probe | Chromosome | Position | Nearest gene | P (dis) | Beta (dis) | FDR (dis) | Study |
|---|---|---|---|---|---|---|---|
| cg14294971 | 9 | 136134067 | ABO | 1.682E-4 | 0.372 | 0.033 | DMG:Wockner_2014 |
Section II. Transcriptome annotation
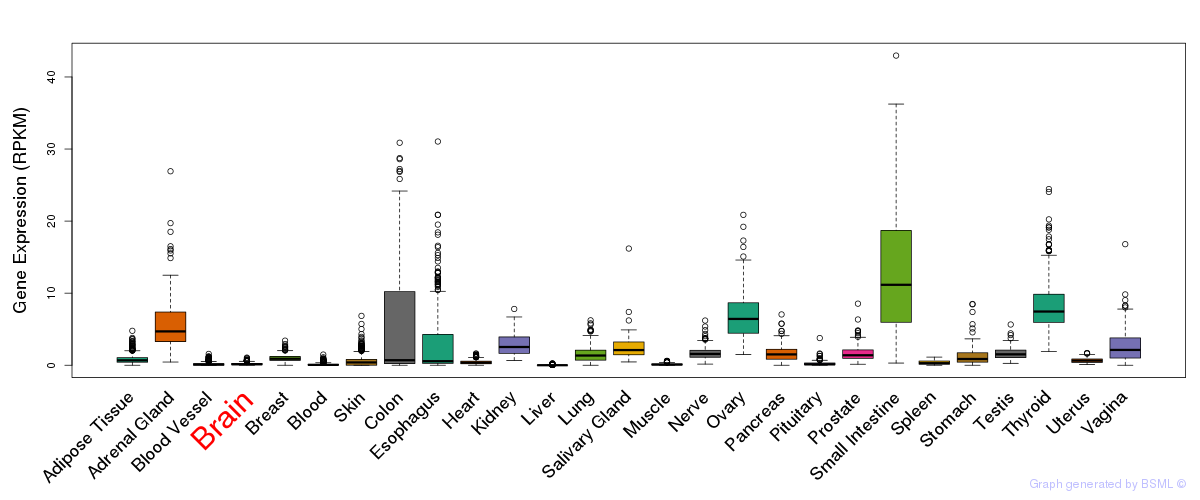
General gene expression (GTEx)
Gene expression during devlopment (BrainCloud)
Footnote:
A total of 269 time points ploted, with n=38 fetal samples (x=1:38). Each triangle represents one time point.
Gene expression of temporal and spatial changes (BrainSpan)
Footnote:
SC: sub-cortical regions; SM: sensory-motor regions; FC: frontal cortex; and TP: temporal-parietal cortex
ST1: fetal (13 - 26 postconception weeks), ST2: early infancy to late childhood (4 months to 11 years), and ST3: adolescence to adulthood (13 - 23 years)
The bar shown representes the lower 25% and upper 25% of the expression distribution.
Top co-expressed genes in brain regions
| Top 10 positively co-expressed genes | ||
| Gene | Pearson's Correlation | Spearman's Correlation |
| PIP5K2B | 0.94 | 0.95 |
| MAP3K7IP3 | 0.94 | 0.96 |
| GRLF1 | 0.94 | 0.95 |
| CAMSAP1 | 0.93 | 0.96 |
| B4GALT5 | 0.93 | 0.95 |
| POLR3A | 0.92 | 0.95 |
| SLC37A3 | 0.92 | 0.94 |
| RALGPS1 | 0.92 | 0.95 |
| PRKAR2A | 0.92 | 0.95 |
| ARFGEF1 | 0.92 | 0.95 |
| Top 10 negatively co-expressed genes | ||
| Gene | Pearson's Correlation | Spearman's Correlation |
| AF347015.31 | -0.75 | -0.85 |
| FXYD1 | -0.74 | -0.84 |
| MT-CO2 | -0.74 | -0.85 |
| TSC22D4 | -0.72 | -0.79 |
| AF347015.27 | -0.72 | -0.82 |
| HSD17B14 | -0.72 | -0.79 |
| HIGD1B | -0.72 | -0.85 |
| IFI27 | -0.72 | -0.82 |
| AF347015.33 | -0.72 | -0.80 |
| S100B | -0.71 | -0.79 |
Section V. Pathway annotation
| Pathway name | Pathway size | # SZGR 2.0 genes in pathway | Info |
|---|---|---|---|
| KEGG GLYCOSPHINGOLIPID BIOSYNTHESIS LACTO AND NEOLACTO SERIES | 26 | 19 | All SZGR 2.0 genes in this pathway |
| JAZAG TGFB1 SIGNALING DN | 35 | 24 | All SZGR 2.0 genes in this pathway |
| PUJANA BRCA1 PCC NETWORK | 1652 | 1023 | All SZGR 2.0 genes in this pathway |
| PUJANA ATM PCC NETWORK | 1442 | 892 | All SZGR 2.0 genes in this pathway |
| PENG GLUCOSE DEPRIVATION DN | 169 | 112 | All SZGR 2.0 genes in this pathway |
| MOREAUX MULTIPLE MYELOMA BY TACI UP | 412 | 249 | All SZGR 2.0 genes in this pathway |
| KIM GASTRIC CANCER CHEMOSENSITIVITY | 103 | 64 | All SZGR 2.0 genes in this pathway |
| ACEVEDO METHYLATED IN LIVER CANCER DN | 940 | 425 | All SZGR 2.0 genes in this pathway |
| RATTENBACHER BOUND BY CELF1 | 467 | 251 | All SZGR 2.0 genes in this pathway |