Gene Page: GPR4
Summary ?
| GeneID | 2828 |
| Symbol | GPR4 |
| Synonyms | - |
| Description | G protein-coupled receptor 4 |
| Reference | MIM:600551|HGNC:HGNC:4497|Ensembl:ENSG00000177464|HPRD:02773|Vega:OTTHUMG00000182126 |
| Gene type | protein-coding |
| Map location | 19q13.3 |
| Pascal p-value | 0.18 |
| Fetal beta | -0.248 |
| DMG | 1 (# studies) |
Gene in Data Sources
| Gene set name | Method of gene set | Description | Info |
|---|---|---|---|
| CV:PGCnp | Genome-wide Association Study | GWAS | |
| DMG:Wockner_2014 | Genome-wide DNA methylation analysis | This dataset includes 4641 differentially methylated probes corresponding to 2929 unique genes between schizophrenia patients (n=24) and controls (n=24). | 1 |
Section I. Genetics and epigenetics annotation
 Differentially methylated gene
| Probe | Chromosome | Position | Nearest gene | P (dis) | Beta (dis) | FDR (dis) | Study |
|---|---|---|---|---|---|---|---|
| cg16620032 | 19 | 46097075 | GPR4 | 5.373E-4 | -0.491 | 0.048 | DMG:Wockner_2014 |
Section II. Transcriptome annotation
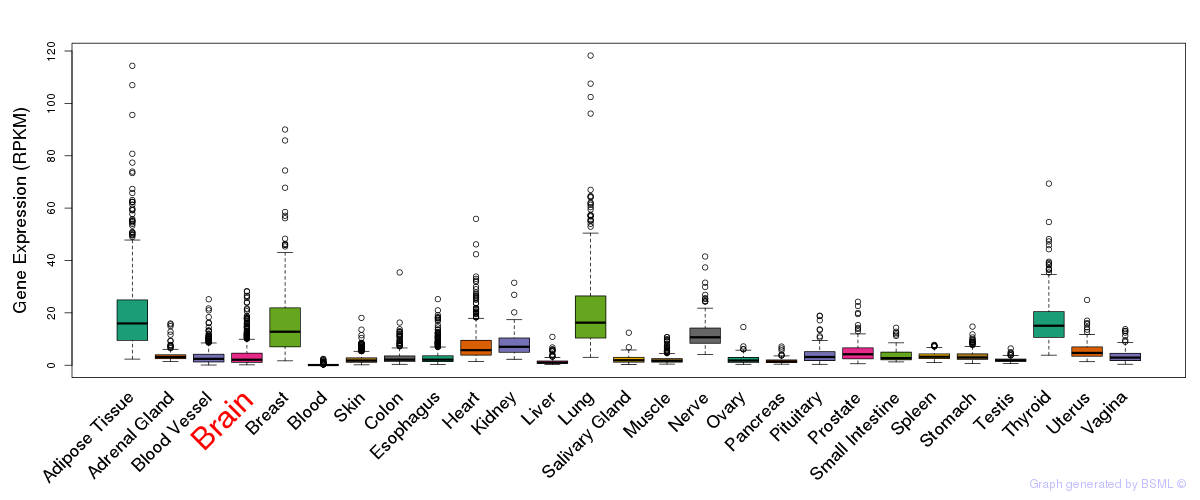
General gene expression (GTEx)
Gene expression during devlopment (BrainCloud)
Footnote:
A total of 269 time points ploted, with n=38 fetal samples (x=1:38). Each triangle represents one time point.
Gene expression of temporal and spatial changes (BrainSpan)
Footnote:
SC: sub-cortical regions; SM: sensory-motor regions; FC: frontal cortex; and TP: temporal-parietal cortex
ST1: fetal (13 - 26 postconception weeks), ST2: early infancy to late childhood (4 months to 11 years), and ST3: adolescence to adulthood (13 - 23 years)
The bar shown representes the lower 25% and upper 25% of the expression distribution.
Top co-expressed genes in brain regions
| Top 10 positively co-expressed genes | ||
| Gene | Pearson's Correlation | Spearman's Correlation |
| NEUROD6 | 0.82 | 0.85 |
| NELL2 | 0.81 | 0.83 |
| ZNF238 | 0.80 | 0.82 |
| C6orf115 | 0.80 | 0.78 |
| KHDRBS3 | 0.80 | 0.83 |
| COMMD2 | 0.79 | 0.72 |
| RLBP1L1 | 0.79 | 0.76 |
| B3GALT2 | 0.78 | 0.84 |
| SSBP2 | 0.78 | 0.76 |
| DPP4 | 0.78 | 0.82 |
| Top 10 negatively co-expressed genes | ||
| Gene | Pearson's Correlation | Spearman's Correlation |
| SERPINB6 | -0.62 | -0.66 |
| HSD17B14 | -0.61 | -0.72 |
| TTYH1 | -0.60 | -0.66 |
| FLT3LG | -0.59 | -0.67 |
| HEPN1 | -0.58 | -0.66 |
| RENBP | -0.58 | -0.65 |
| MMD2 | -0.58 | -0.73 |
| AIFM3 | -0.57 | -0.65 |
| HLA-F | -0.56 | -0.62 |
| C11orf67 | -0.56 | -0.66 |
Section V. Pathway annotation
| Pathway name | Pathway size | # SZGR 2.0 genes in pathway | Info |
|---|---|---|---|
| REACTOME GASTRIN CREB SIGNALLING PATHWAY VIA PKC AND MAPK | 205 | 136 | All SZGR 2.0 genes in this pathway |
| REACTOME SIGNALING BY GPCR | 920 | 449 | All SZGR 2.0 genes in this pathway |
| REACTOME CLASS A1 RHODOPSIN LIKE RECEPTORS | 305 | 177 | All SZGR 2.0 genes in this pathway |
| REACTOME G ALPHA Q SIGNALLING EVENTS | 184 | 116 | All SZGR 2.0 genes in this pathway |
| REACTOME GPCR DOWNSTREAM SIGNALING | 805 | 368 | All SZGR 2.0 genes in this pathway |
| REACTOME GPCR LIGAND BINDING | 408 | 246 | All SZGR 2.0 genes in this pathway |
| GAL LEUKEMIC STEM CELL UP | 133 | 78 | All SZGR 2.0 genes in this pathway |
| BENPORATH MYC TARGETS WITH EBOX | 230 | 156 | All SZGR 2.0 genes in this pathway |
| FERNANDEZ BOUND BY MYC | 182 | 116 | All SZGR 2.0 genes in this pathway |
| BLALOCK ALZHEIMERS DISEASE UP | 1691 | 1088 | All SZGR 2.0 genes in this pathway |
| LIN NPAS4 TARGETS DN | 68 | 48 | All SZGR 2.0 genes in this pathway |
| DANG BOUND BY MYC | 1103 | 714 | All SZGR 2.0 genes in this pathway |
| MIKKELSEN MEF HCP WITH H3K27ME3 | 590 | 403 | All SZGR 2.0 genes in this pathway |
| PURBEY TARGETS OF CTBP1 AND SATB1 DN | 180 | 116 | All SZGR 2.0 genes in this pathway |
| ZWANG TRANSIENTLY UP BY 2ND EGF PULSE ONLY | 1725 | 838 | All SZGR 2.0 genes in this pathway |