Gene Page: MIR7-3HG
Summary ?
| GeneID | 284424 |
| Symbol | MIR7-3HG |
| Synonyms | C19orf30|Huh7|LINC00306|NCRNA00306|PGSF1|uc002mbe.2 |
| Description | MIR7-3 host gene |
| Reference | HGNC:HGNC:30049|Ensembl:ENSG00000176840|HPRD:16628| |
| Gene type | ncRNA |
| Map location | 19p13.3 |
| Pascal p-value | 0.357 |
| Sherlock p-value | 0.903 |
| Fetal beta | -3.528 |
| DMG | 1 (# studies) |
| eGene | Anterior cingulate cortex BA24 Cerebellar Hemisphere Cerebellum Cortex Frontal Cortex BA9 |
Gene in Data Sources
| Gene set name | Method of gene set | Description | Info |
|---|---|---|---|
| CV:PGCnp | Genome-wide Association Study | GWAS | |
| DMG:Jaffe_2016 | Genome-wide DNA methylation analysis | This dataset includes 2,104 probes/CpGs associated with SZ patients (n=108) compared to 136 controls at Bonferroni-adjusted P < 0.05. | 1 |
Section I. Genetics and epigenetics annotation
 Differentially methylated gene
| Probe | Chromosome | Position | Nearest gene | P (dis) | Beta (dis) | FDR (dis) | Study |
|---|---|---|---|---|---|---|---|
| cg04640886 | 19 | 4769592 | MIR7-3HG | 7.03E-8 | -0.028 | 1.7E-5 | DMG:Jaffe_2016 |
eQTL annotation
| SNP ID | Chromosome | Position | eGene | Gene Entrez ID | pvalue | qvalue | TSS distance | eQTL type |
|---|---|---|---|---|---|---|---|---|
| rs3760955 | 19 | 4772202 | MIR7-3HG | ENSG00000176840.7 | 3.01581E-9 | 0 | 3085 | gtex_brain_ba24 |
Section II. Transcriptome annotation
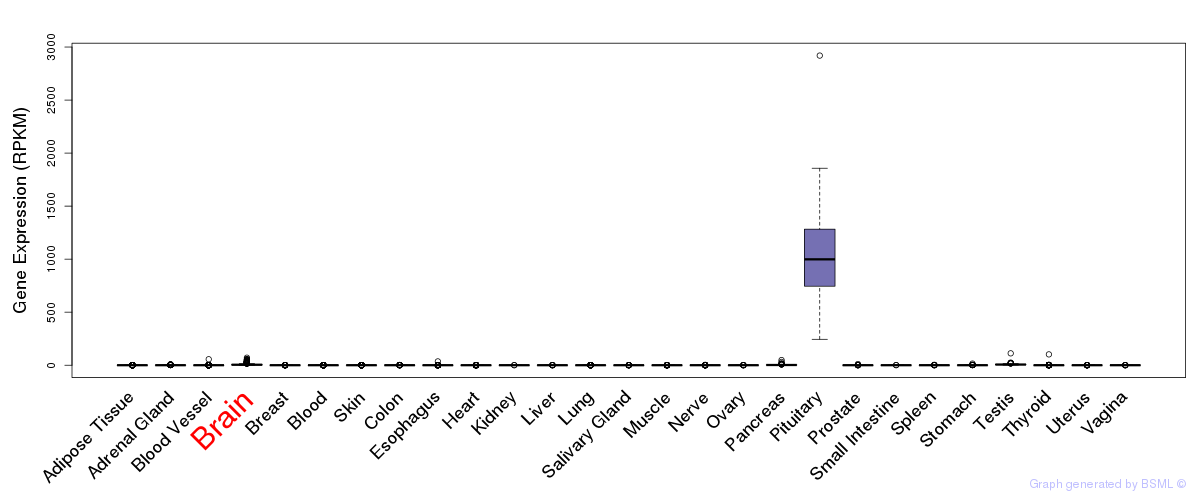
General gene expression (GTEx)
Gene expression during devlopment (BrainCloud)
Footnote:
A total of 269 time points ploted, with n=38 fetal samples (x=1:38). Each triangle represents one time point.
Gene expression of temporal and spatial changes (BrainSpan)
Footnote:
SC: sub-cortical regions; SM: sensory-motor regions; FC: frontal cortex; and TP: temporal-parietal cortex
ST1: fetal (13 - 26 postconception weeks), ST2: early infancy to late childhood (4 months to 11 years), and ST3: adolescence to adulthood (13 - 23 years)
The bar shown representes the lower 25% and upper 25% of the expression distribution.
No co-expressed genes in brain regions
Section V. Pathway annotation
| Pathway name | Pathway size | # SZGR 2.0 genes in pathway | Info |
|---|---|---|---|
| ZWANG TRANSIENTLY UP BY 2ND EGF PULSE ONLY | 1725 | 838 | All SZGR 2.0 genes in this pathway |