Gene Page: RPUSD3
Summary ?
| GeneID | 285367 |
| Symbol | RPUSD3 |
| Synonyms | - |
| Description | RNA pseudouridylate synthase domain containing 3 |
| Reference | HGNC:HGNC:28437|Ensembl:ENSG00000156990|HPRD:14532|Vega:OTTHUMG00000128441 |
| Gene type | protein-coding |
| Map location | 3p25.3 |
| Pascal p-value | 0.415 |
| Sherlock p-value | 0.364 |
| Fetal beta | -0.805 |
| DMG | 1 (# studies) |
| eGene | Caudate basal ganglia Cerebellar Hemisphere Cerebellum Cortex Frontal Cortex BA9 Hypothalamus Nucleus accumbens basal ganglia Putamen basal ganglia Myers' cis & trans Meta |
| Support | CompositeSet |
Gene in Data Sources
| Gene set name | Method of gene set | Description | Info |
|---|---|---|---|
| CV:PGCnp | Genome-wide Association Study | GWAS | |
| DMG:vanEijk_2014 | Genome-wide DNA methylation analysis | This dataset includes 432 differentially methylated CpG sites corresponding to 391 unique transcripts between schizophrenia patients (n=260) and unaffected controls (n=250). | 2 |
| DNM:Fromer_2014 | Whole Exome Sequencing analysis | This study reported a WES study of 623 schizophrenia trios, reporting DNMs using genomic DNA. |
Section I. Genetics and epigenetics annotation
 DNM table
| Gene | Chromosome | Position | Ref | Alt | Transcript | AA change | Mutation type | Sift | CG46 | Trait | Study |
|---|---|---|---|---|---|---|---|---|---|---|---|
| RPUSD3 | chr3 | 9881966 | C | T | NM_001142547 NM_173659 | p.194R>Q p.209R>Q | missense missense | Schizophrenia | DNM:Fromer_2014 |
Differentially methylated gene
| Probe | Chromosome | Position | Nearest gene | P (dis) | Beta (dis) | FDR (dis) | Study |
|---|---|---|---|---|---|---|---|
| cg24596576 | 3 | 10067780 | RPUSD3 | 4.897E-4 | 3.387 | DMG:vanEijk_2014 | |
| cg07614786 | 3 | 9860331 | RPUSD3 | 0.001 | -3.555 | DMG:vanEijk_2014 |
eQTL annotation
| SNP ID | Chromosome | Position | eGene | Gene Entrez ID | pvalue | qvalue | TSS distance | eQTL type |
|---|---|---|---|---|---|---|---|---|
| rs2040557 | chr9 | 135765563 | RPUSD3 | 285367 | 0.05 | trans | ||
| rs57223920 | 3 | 9885109 | RPUSD3 | ENSG00000156990.10 | 5.96057E-8 | 0 | 1177 | gtex_brain_putamen_basal |
| rs2290306 | 3 | 9885615 | RPUSD3 | ENSG00000156990.10 | 5.90942E-8 | 0 | 671 | gtex_brain_putamen_basal |
| rs71314367 | 3 | 9888113 | RPUSD3 | ENSG00000156990.10 | 5.76E-8 | 0 | -1827 | gtex_brain_putamen_basal |
| rs17050606 | 3 | 9888685 | RPUSD3 | ENSG00000156990.10 | 5.76432E-8 | 0 | -2399 | gtex_brain_putamen_basal |
| rs140688906 | 3 | 9889917 | RPUSD3 | ENSG00000156990.10 | 3.93558E-8 | 0 | -3631 | gtex_brain_putamen_basal |
Section II. Transcriptome annotation
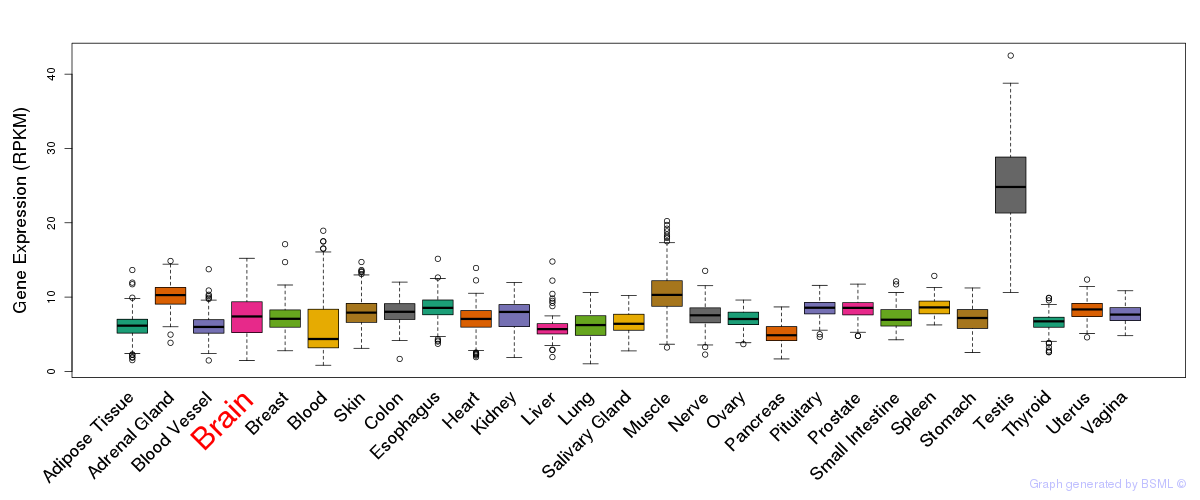
General gene expression (GTEx)
Gene expression during devlopment (BrainCloud)
Footnote:
A total of 269 time points ploted, with n=38 fetal samples (x=1:38). Each triangle represents one time point.
Gene expression of temporal and spatial changes (BrainSpan)
Footnote:
SC: sub-cortical regions; SM: sensory-motor regions; FC: frontal cortex; and TP: temporal-parietal cortex
ST1: fetal (13 - 26 postconception weeks), ST2: early infancy to late childhood (4 months to 11 years), and ST3: adolescence to adulthood (13 - 23 years)
The bar shown representes the lower 25% and upper 25% of the expression distribution.
No co-expressed genes in brain regions
Section V. Pathway annotation
| Pathway name | Pathway size | # SZGR 2.0 genes in pathway | Info |
|---|---|---|---|
| ZHOU INFLAMMATORY RESPONSE LIVE DN | 384 | 220 | All SZGR 2.0 genes in this pathway |
| ZHOU INFLAMMATORY RESPONSE FIMA DN | 284 | 156 | All SZGR 2.0 genes in this pathway |
| RODRIGUES THYROID CARCINOMA POORLY DIFFERENTIATED DN | 805 | 505 | All SZGR 2.0 genes in this pathway |
| KRIEG KDM3A TARGETS NOT HYPOXIA | 208 | 107 | All SZGR 2.0 genes in this pathway |
| FOSTER KDM1A TARGETS DN | 211 | 119 | All SZGR 2.0 genes in this pathway |