Gene Page: TPRN
Summary ?
| GeneID | 286262 |
| Symbol | TPRN |
| Synonyms | C9orf75|DFNB79 |
| Description | taperin |
| Reference | MIM:613354|HGNC:HGNC:26894|Ensembl:ENSG00000176058|HPRD:12977|Vega:OTTHUMG00000020984 |
| Gene type | protein-coding |
| Map location | 9q34.3 |
| Pascal p-value | 0.055 |
| Sherlock p-value | 0.199 |
| Fetal beta | -0.75 |
| DMG | 1 (# studies) |
| eGene | Myers' cis & trans Meta |
Gene in Data Sources
| Gene set name | Method of gene set | Description | Info |
|---|---|---|---|
| CV:PGCnp | Genome-wide Association Study | GWAS | |
| DMG:Jaffe_2016 | Genome-wide DNA methylation analysis | This dataset includes 2,104 probes/CpGs associated with SZ patients (n=108) compared to 136 controls at Bonferroni-adjusted P < 0.05. | 1 |
Section I. Genetics and epigenetics annotation
 Differentially methylated gene
| Probe | Chromosome | Position | Nearest gene | P (dis) | Beta (dis) | FDR (dis) | Study |
|---|---|---|---|---|---|---|---|
| cg00486101 | 9 | 140095351 | TPRN | 3.95E-8 | -0.008 | 1.12E-5 | DMG:Jaffe_2016 |
eQTL annotation
| SNP ID | Chromosome | Position | eGene | Gene Entrez ID | pvalue | qvalue | TSS distance | eQTL type |
|---|---|---|---|---|---|---|---|---|
| rs3845734 | chr2 | 171125572 | TPRN | 286262 | 0.18 | trans | ||
| rs16955618 | chr15 | 29937543 | TPRN | 286262 | 0.09 | trans |
Section II. Transcriptome annotation
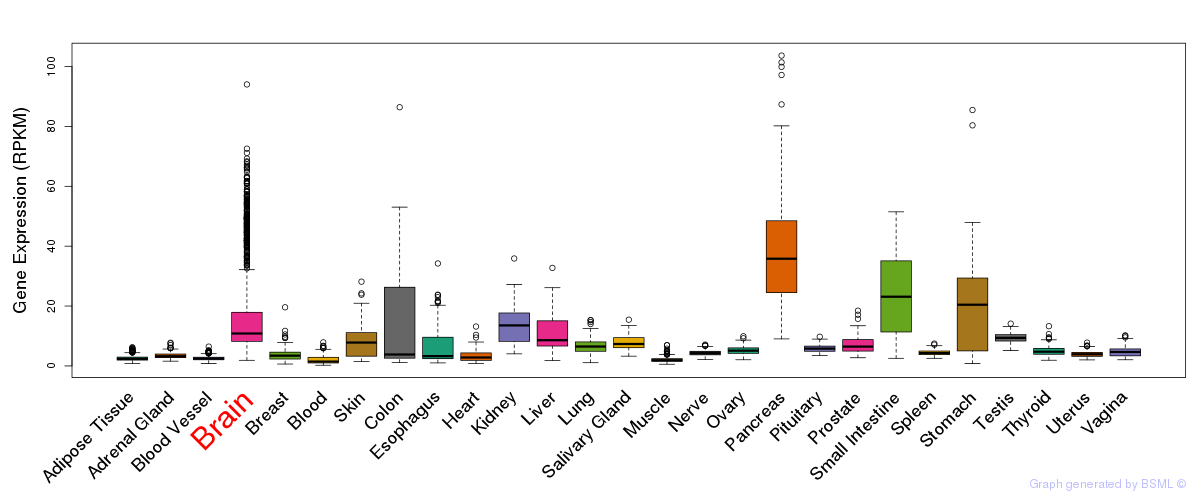
General gene expression (GTEx)
Gene expression during devlopment (BrainCloud)
Footnote:
A total of 269 time points ploted, with n=38 fetal samples (x=1:38). Each triangle represents one time point.
Gene expression of temporal and spatial changes (BrainSpan)
Footnote:
SC: sub-cortical regions; SM: sensory-motor regions; FC: frontal cortex; and TP: temporal-parietal cortex
ST1: fetal (13 - 26 postconception weeks), ST2: early infancy to late childhood (4 months to 11 years), and ST3: adolescence to adulthood (13 - 23 years)
The bar shown representes the lower 25% and upper 25% of the expression distribution.
No co-expressed genes in brain regions
Section V. Pathway annotation
| Pathway name | Pathway size | # SZGR 2.0 genes in pathway | Info |
|---|---|---|---|
| MARSON BOUND BY FOXP3 UNSTIMULATED | 1229 | 713 | All SZGR 2.0 genes in this pathway |
| BILANGES RAPAMYCIN SENSITIVE GENES | 39 | 20 | All SZGR 2.0 genes in this pathway |