Gene Page: CNIH4
Summary ?
| GeneID | 29097 |
| Symbol | CNIH4 |
| Synonyms | CNIH-4|HSPC163 |
| Description | cornichon family AMPA receptor auxiliary protein 4 |
| Reference | HGNC:HGNC:25013|Ensembl:ENSG00000143771|HPRD:13709|Vega:OTTHUMG00000037635 |
| Gene type | protein-coding |
| Map location | 1q42.11 |
| Sherlock p-value | 0.005 |
| Fetal beta | 0.476 |
| eGene | Myers' cis & trans Meta |
Gene in Data Sources
| Gene set name | Method of gene set | Description | Info |
|---|---|---|---|
| CV:PGCnp | Genome-wide Association Study | GWAS | |
| Expression | Meta-analysis of gene expression | P value: 2.719 |
Section I. Genetics and epigenetics annotation
 eQTL annotation
| SNP ID | Chromosome | Position | eGene | Gene Entrez ID | pvalue | qvalue | TSS distance | eQTL type |
|---|---|---|---|---|---|---|---|---|
| rs4685080 | chr3 | 14253946 | CNIH4 | 29097 | 0.2 | trans |
Section II. Transcriptome annotation
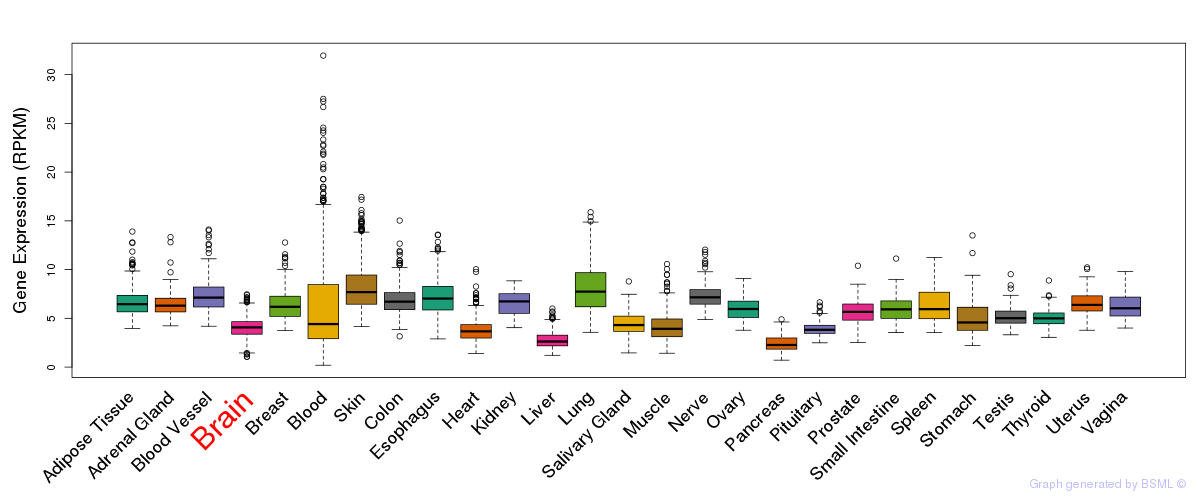
General gene expression (GTEx)
Gene expression during devlopment (BrainCloud)
Footnote:
A total of 269 time points ploted, with n=38 fetal samples (x=1:38). Each triangle represents one time point.
Gene expression of temporal and spatial changes (BrainSpan)
Footnote:
SC: sub-cortical regions; SM: sensory-motor regions; FC: frontal cortex; and TP: temporal-parietal cortex
ST1: fetal (13 - 26 postconception weeks), ST2: early infancy to late childhood (4 months to 11 years), and ST3: adolescence to adulthood (13 - 23 years)
The bar shown representes the lower 25% and upper 25% of the expression distribution.
No co-expressed genes in brain regions
Section III. Gene Ontology annotation
| Molecular function | GO term | Evidence | Neuro keywords | PubMed ID |
|---|---|---|---|---|
| GO:0005515 | protein binding | IPI | 17353931 | |
| Biological process | GO term | Evidence | Neuro keywords | PubMed ID |
| GO:0007242 | intracellular signaling cascade | IEA | - | |
| Cellular component | GO term | Evidence | Neuro keywords | PubMed ID |
| GO:0005783 | endoplasmic reticulum | IDA | 11256614 | |
| GO:0016020 | membrane | IEA | - | |
| GO:0016021 | integral to membrane | IEA | - |
Section V. Pathway annotation
| Pathway name | Pathway size | # SZGR 2.0 genes in pathway | Info |
|---|---|---|---|
| WINTER HYPOXIA UP | 92 | 57 | All SZGR 2.0 genes in this pathway |
| ONKEN UVEAL MELANOMA UP | 783 | 507 | All SZGR 2.0 genes in this pathway |
| CASORELLI APL SECONDARY VS DE NOVO UP | 39 | 25 | All SZGR 2.0 genes in this pathway |
| LAIHO COLORECTAL CANCER SERRATED UP | 112 | 71 | All SZGR 2.0 genes in this pathway |
| MULLIGHAN MLL SIGNATURE 1 UP | 380 | 236 | All SZGR 2.0 genes in this pathway |
| MULLIGHAN MLL SIGNATURE 2 UP | 418 | 263 | All SZGR 2.0 genes in this pathway |
| KINSEY TARGETS OF EWSR1 FLII FUSION UP | 1278 | 748 | All SZGR 2.0 genes in this pathway |
| DODD NASOPHARYNGEAL CARCINOMA DN | 1375 | 806 | All SZGR 2.0 genes in this pathway |
| PEREZ TP53 TARGETS | 1174 | 695 | All SZGR 2.0 genes in this pathway |
| PATIL LIVER CANCER | 747 | 453 | All SZGR 2.0 genes in this pathway |
| NUYTTEN NIPP1 TARGETS UP | 769 | 437 | All SZGR 2.0 genes in this pathway |
| BENPORATH CYCLING GENES | 648 | 385 | All SZGR 2.0 genes in this pathway |
| BENPORATH PROLIFERATION | 147 | 80 | All SZGR 2.0 genes in this pathway |
| DOUGLAS BMI1 TARGETS UP | 566 | 371 | All SZGR 2.0 genes in this pathway |
| MASSARWEH TAMOXIFEN RESISTANCE UP | 578 | 341 | All SZGR 2.0 genes in this pathway |
| ACEVEDO LIVER CANCER UP | 973 | 570 | All SZGR 2.0 genes in this pathway |
| ACEVEDO LIVER TUMOR VS NORMAL ADJACENT TISSUE UP | 863 | 514 | All SZGR 2.0 genes in this pathway |
| EHLERS ANEUPLOIDY DN | 12 | 8 | All SZGR 2.0 genes in this pathway |
| WHITFIELD CELL CYCLE M G1 | 148 | 95 | All SZGR 2.0 genes in this pathway |
| JOHNSTONE PARVB TARGETS 3 UP | 430 | 288 | All SZGR 2.0 genes in this pathway |
| KOINUMA TARGETS OF SMAD2 OR SMAD3 | 824 | 528 | All SZGR 2.0 genes in this pathway |
| DELACROIX RARG BOUND MEF | 367 | 231 | All SZGR 2.0 genes in this pathway |
| RATTENBACHER BOUND BY CELF1 | 467 | 251 | All SZGR 2.0 genes in this pathway |
Section VI. microRNA annotation
| miRNA family | Target position | miRNA ID | miRNA seq | ||
|---|---|---|---|---|---|
| UTR start | UTR end | Match method | |||
| miR-375 | 115 | 121 | 1A | hsa-miR-375 | UUUGUUCGUUCGGCUCGCGUGA |
- SZ: miRNAs which differentially expressed in brain cortex of schizophrenia patients comparing with control samples using microarray. Click here to see the list of SZ related miRNAs.
- Brain: miRNAs which are expressed in brain based on miRNA microarray expression studies. Click here to see the list of brain related miRNAs.