Gene Page: GUCY1B2
Summary ?
| GeneID | 2974 |
| Symbol | GUCY1B2 |
| Synonyms | GC-SB2 |
| Description | guanylate cyclase 1, soluble, beta 2 (pseudogene) |
| Reference | MIM:603695|HGNC:HGNC:4686|Ensembl:ENSG00000123201|HPRD:07542| |
| Gene type | pseudo |
| Map location | 13q14.3 |
| Pascal p-value | 0.258 |
| Fetal beta | 0.386 |
| eGene | Caudate basal ganglia Nucleus accumbens basal ganglia Putamen basal ganglia |
Gene in Data Sources
| Gene set name | Method of gene set | Description | Info |
|---|---|---|---|
| CV:PGCnp | Genome-wide Association Study | GWAS | |
| PMID:cooccur | High-throughput literature-search | Systematic search in PubMed for genes co-occurring with SCZ keywords. A total of 3027 genes were included. | |
| Literature | High-throughput literature-search | Co-occurance with Schizophrenia keywords: schizophrenia,schizophrenias | Click to show details |
Section I. Genetics and epigenetics annotation
 eQTL annotation
| SNP ID | Chromosome | Position | eGene | Gene Entrez ID | pvalue | qvalue | TSS distance | eQTL type |
|---|---|---|---|---|---|---|---|---|
| rs1475447 | 13 | 51631607 | GUCY1B2 | ENSG00000123201.10 | 2.754E-8 | 0 | 23391 | gtex_brain_putamen_basal |
| rs4942946 | 13 | 51634480 | GUCY1B2 | ENSG00000123201.10 | 5.91E-11 | 0 | 20518 | gtex_brain_putamen_basal |
| rs6561609 | 13 | 51638146 | GUCY1B2 | ENSG00000123201.10 | 5.686E-11 | 0 | 16852 | gtex_brain_putamen_basal |
| rs6561610 | 13 | 51638170 | GUCY1B2 | ENSG00000123201.10 | 5.686E-11 | 0 | 16828 | gtex_brain_putamen_basal |
| rs6561611 | 13 | 51638235 | GUCY1B2 | ENSG00000123201.10 | 3.91E-8 | 0 | 16763 | gtex_brain_putamen_basal |
| rs9596435 | 13 | 51641473 | GUCY1B2 | ENSG00000123201.10 | 1.054E-8 | 0 | 13525 | gtex_brain_putamen_basal |
| rs7337587 | 13 | 51642242 | GUCY1B2 | ENSG00000123201.10 | 5.874E-11 | 0 | 12756 | gtex_brain_putamen_basal |
| rs7338712 | 13 | 51642303 | GUCY1B2 | ENSG00000123201.10 | 2.298E-9 | 0 | 12695 | gtex_brain_putamen_basal |
| rs12869642 | 13 | 51642548 | GUCY1B2 | ENSG00000123201.10 | 2.177E-6 | 0 | 12450 | gtex_brain_putamen_basal |
| rs17593235 | 13 | 51642595 | GUCY1B2 | ENSG00000123201.10 | 8.872E-8 | 0 | 12403 | gtex_brain_putamen_basal |
| rs17593270 | 13 | 51642668 | GUCY1B2 | ENSG00000123201.10 | 2.206E-7 | 0 | 12330 | gtex_brain_putamen_basal |
| rs17593291 | 13 | 51642699 | GUCY1B2 | ENSG00000123201.10 | 8.891E-8 | 0 | 12299 | gtex_brain_putamen_basal |
| rs12870315 | 13 | 51642708 | GUCY1B2 | ENSG00000123201.10 | 1.021E-12 | 0 | 12290 | gtex_brain_putamen_basal |
| rs12870383 | 13 | 51642931 | GUCY1B2 | ENSG00000123201.10 | 1.021E-12 | 0 | 12067 | gtex_brain_putamen_basal |
| rs1328358 | 13 | 51643053 | GUCY1B2 | ENSG00000123201.10 | 2.065E-6 | 0 | 11945 | gtex_brain_putamen_basal |
| rs7325888 | 13 | 51643678 | GUCY1B2 | ENSG00000123201.10 | 1.114E-12 | 0 | 11320 | gtex_brain_putamen_basal |
| rs55865930 | 13 | 51644476 | GUCY1B2 | ENSG00000123201.10 | 1.202E-7 | 0 | 10522 | gtex_brain_putamen_basal |
| rs4605050 | 13 | 51645674 | GUCY1B2 | ENSG00000123201.10 | 3.627E-12 | 0 | 9324 | gtex_brain_putamen_basal |
| rs9563016 | 13 | 51646895 | GUCY1B2 | ENSG00000123201.10 | 3.01E-6 | 0 | 8103 | gtex_brain_putamen_basal |
| rs9535567 | 13 | 51648632 | GUCY1B2 | ENSG00000123201.10 | 4.741E-10 | 0 | 6366 | gtex_brain_putamen_basal |
| rs9535573 | 13 | 51655576 | GUCY1B2 | ENSG00000123201.10 | 9.966E-11 | 0 | -578 | gtex_brain_putamen_basal |
| rs7336329 | 13 | 51663251 | GUCY1B2 | ENSG00000123201.10 | 3.092E-10 | 0 | -8253 | gtex_brain_putamen_basal |
| rs9535575 | 13 | 51668648 | GUCY1B2 | ENSG00000123201.10 | 2.243E-11 | 0 | -13650 | gtex_brain_putamen_basal |
| rs7328201 | 13 | 51674307 | GUCY1B2 | ENSG00000123201.10 | 8.993E-8 | 0 | -19309 | gtex_brain_putamen_basal |
Section II. Transcriptome annotation
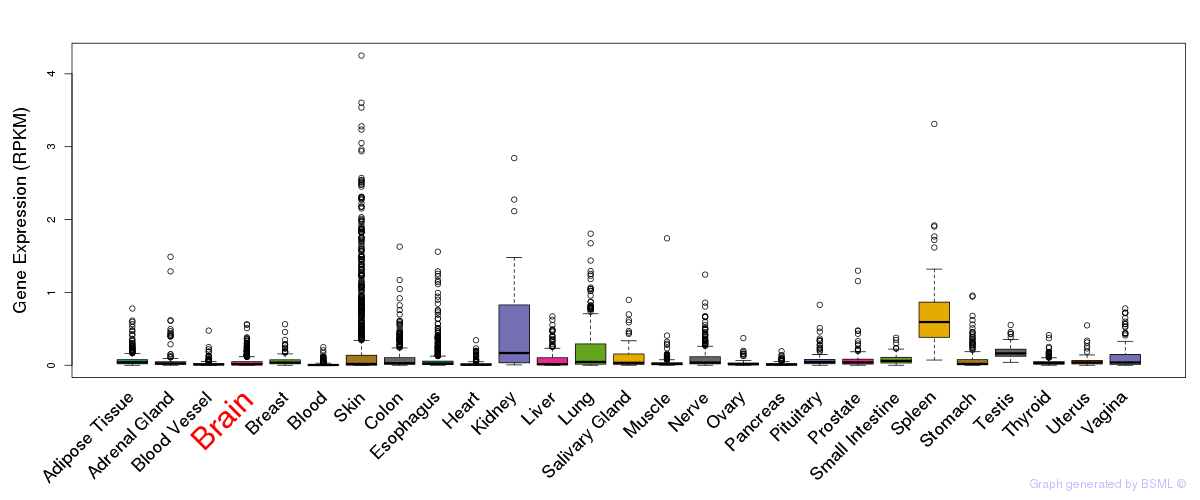
General gene expression (GTEx)
Gene expression during devlopment (BrainCloud)
Footnote:
A total of 269 time points ploted, with n=38 fetal samples (x=1:38). Each triangle represents one time point.
Gene expression of temporal and spatial changes (BrainSpan)
Footnote:
SC: sub-cortical regions; SM: sensory-motor regions; FC: frontal cortex; and TP: temporal-parietal cortex
ST1: fetal (13 - 26 postconception weeks), ST2: early infancy to late childhood (4 months to 11 years), and ST3: adolescence to adulthood (13 - 23 years)
The bar shown representes the lower 25% and upper 25% of the expression distribution.
No co-expressed genes in brain regions
Section V. Pathway annotation
| Pathway name | Pathway size | # SZGR 2.0 genes in pathway | Info |
|---|---|---|---|
| BRUINS UVC RESPONSE EARLY LATE | 317 | 190 | All SZGR 2.0 genes in this pathway |
| PURBEY TARGETS OF CTBP1 AND SATB1 DN | 180 | 116 | All SZGR 2.0 genes in this pathway |