Gene Page: HSBP1
Summary ?
| GeneID | 3281 |
| Symbol | HSBP1 |
| Synonyms | NPC-A-13 |
| Description | heat shock factor binding protein 1 |
| Reference | MIM:604553|HGNC:HGNC:5203|HPRD:05185| |
| Gene type | protein-coding |
| Map location | 16q23.3 |
| Pascal p-value | 0.261 |
| Sherlock p-value | 0.006 |
| Fetal beta | 0.546 |
Gene in Data Sources
| Gene set name | Method of gene set | Description | Info |
|---|---|---|---|
| CV:PGCnp | Genome-wide Association Study | GWAS |
Section I. Genetics and epigenetics annotation
Section II. Transcriptome annotation
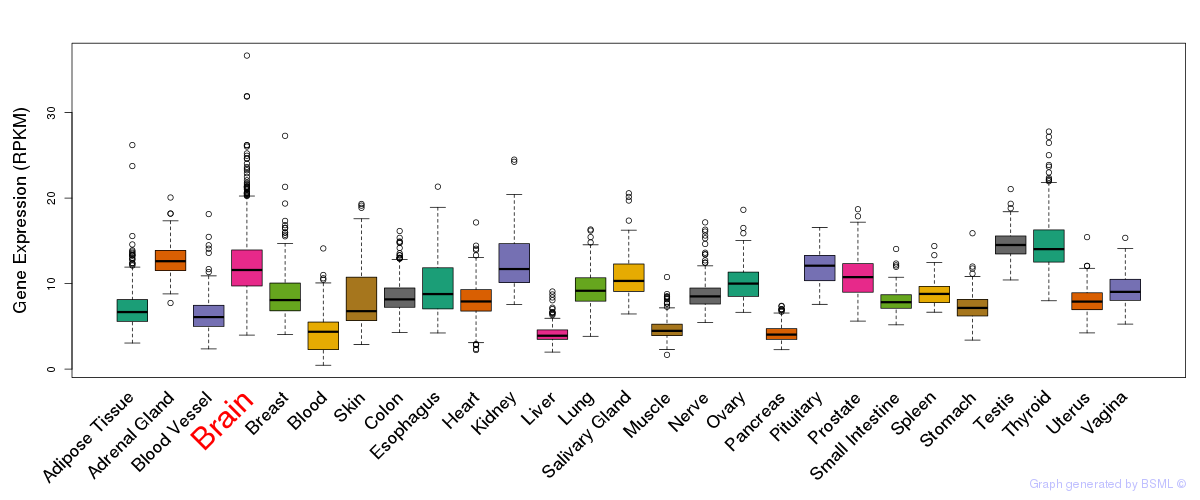
General gene expression (GTEx)
Gene expression during devlopment (BrainCloud)
Footnote:
A total of 269 time points ploted, with n=38 fetal samples (x=1:38). Each triangle represents one time point.
Gene expression of temporal and spatial changes (BrainSpan)
Footnote:
SC: sub-cortical regions; SM: sensory-motor regions; FC: frontal cortex; and TP: temporal-parietal cortex
ST1: fetal (13 - 26 postconception weeks), ST2: early infancy to late childhood (4 months to 11 years), and ST3: adolescence to adulthood (13 - 23 years)
The bar shown representes the lower 25% and upper 25% of the expression distribution.
Top co-expressed genes in brain regions
| Top 10 positively co-expressed genes | ||
| Gene | Pearson's Correlation | Spearman's Correlation |
| DNAJB6 | 0.93 | 0.94 |
| YWHAE | 0.93 | 0.91 |
| ACTR3 | 0.92 | 0.93 |
| DR1 | 0.92 | 0.90 |
| TARS | 0.91 | 0.91 |
| SNX4 | 0.91 | 0.90 |
| MATR3 | 0.91 | 0.90 |
| CUL3 | 0.91 | 0.91 |
| GLOD4 | 0.90 | 0.91 |
| C1orf149 | 0.90 | 0.89 |
| Top 10 negatively co-expressed genes | ||
| Gene | Pearson's Correlation | Spearman's Correlation |
| FXYD1 | -0.74 | -0.81 |
| MT-CO2 | -0.71 | -0.77 |
| AF347015.33 | -0.71 | -0.77 |
| AF347015.31 | -0.69 | -0.76 |
| IFI27 | -0.69 | -0.79 |
| TSC22D4 | -0.69 | -0.75 |
| AC018755.7 | -0.68 | -0.74 |
| AC021016.1 | -0.68 | -0.76 |
| AF347015.8 | -0.68 | -0.75 |
| HIGD1B | -0.67 | -0.78 |
Section V. Pathway annotation
| Pathway name | Pathway size | # SZGR 2.0 genes in pathway | Info |
|---|---|---|---|
| HOLLMANN APOPTOSIS VIA CD40 DN | 267 | 178 | All SZGR 2.0 genes in this pathway |
| DAVICIONI MOLECULAR ARMS VS ERMS UP | 332 | 228 | All SZGR 2.0 genes in this pathway |
| TIEN INTESTINE PROBIOTICS 24HR UP | 557 | 331 | All SZGR 2.0 genes in this pathway |
| DODD NASOPHARYNGEAL CARCINOMA UP | 1821 | 933 | All SZGR 2.0 genes in this pathway |
| GRAESSMANN APOPTOSIS BY DOXORUBICIN UP | 1142 | 669 | All SZGR 2.0 genes in this pathway |
| GRAESSMANN RESPONSE TO MC AND DOXORUBICIN UP | 612 | 367 | All SZGR 2.0 genes in this pathway |
| NUYTTEN EZH2 TARGETS DN | 1024 | 594 | All SZGR 2.0 genes in this pathway |
| LOPEZ MBD TARGETS | 957 | 597 | All SZGR 2.0 genes in this pathway |
| SHEPARD BMYB MORPHOLINO UP | 205 | 126 | All SZGR 2.0 genes in this pathway |
| FLECHNER BIOPSY KIDNEY TRANSPLANT OK VS DONOR UP | 555 | 346 | All SZGR 2.0 genes in this pathway |
| THEILGAARD NEUTROPHIL AT SKIN WOUND DN | 225 | 163 | All SZGR 2.0 genes in this pathway |
| MARTINEZ RESPONSE TO TRABECTEDIN UP | 71 | 49 | All SZGR 2.0 genes in this pathway |
| BLALOCK ALZHEIMERS DISEASE UP | 1691 | 1088 | All SZGR 2.0 genes in this pathway |
| TSENG IRS1 TARGETS DN | 135 | 88 | All SZGR 2.0 genes in this pathway |
| WANG CISPLATIN RESPONSE AND XPC UP | 202 | 115 | All SZGR 2.0 genes in this pathway |
| TSENG ADIPOGENIC POTENTIAL DN | 46 | 28 | All SZGR 2.0 genes in this pathway |
| CREIGHTON ENDOCRINE THERAPY RESISTANCE 3 | 720 | 440 | All SZGR 2.0 genes in this pathway |
| ACEVEDO LIVER CANCER DN | 540 | 340 | All SZGR 2.0 genes in this pathway |
| ACEVEDO LIVER TUMOR VS NORMAL ADJACENT TISSUE DN | 274 | 165 | All SZGR 2.0 genes in this pathway |
| ACEVEDO LIVER CANCER WITH H3K27ME3 UP | 295 | 149 | All SZGR 2.0 genes in this pathway |
| KIM BIPOLAR DISORDER OLIGODENDROCYTE DENSITY CORR UP | 682 | 440 | All SZGR 2.0 genes in this pathway |