Gene Page: FREM2
Summary ?
| GeneID | 341640 |
| Symbol | FREM2 |
| Synonyms | - |
| Description | FRAS1 related extracellular matrix protein 2 |
| Reference | MIM:608945|HGNC:HGNC:25396|Ensembl:ENSG00000150893|HPRD:10602|Vega:OTTHUMG00000016759 |
| Gene type | protein-coding |
| Map location | 13q13.3 |
| Pascal p-value | 0.35 |
| Fetal beta | -0.686 |
| DMG | 1 (# studies) |
| eGene | Anterior cingulate cortex BA24 Caudate basal ganglia Cortex Frontal Cortex BA9 Putamen basal ganglia Myers' cis & trans |
| Support | Ascano FMRP targets |
Gene in Data Sources
| Gene set name | Method of gene set | Description | Info |
|---|---|---|---|
| CV:PGCnp | Genome-wide Association Study | GWAS | |
| DMG:Jaffe_2016 | Genome-wide DNA methylation analysis | This dataset includes 2,104 probes/CpGs associated with SZ patients (n=108) compared to 136 controls at Bonferroni-adjusted P < 0.05. | 1 |
| DNM:Ambalavanan_2016 | Whole Exome Sequencing | This dataset includes 20 de novo mutations detected in 17 COS probands. |
Section I. Genetics and epigenetics annotation
 DNM table
| Gene | Chromosome | Position | Ref | Alt | Transcript | AA change | Mutation type | Sift | CG46 | Trait | Study |
|---|---|---|---|---|---|---|---|---|---|---|---|
| FREM2 | chr13 | 39450228 | G | A | NM_207361 | p.(Arg2784Lys) | nonsynonymous SNV | 0.941 | Childhood-onset schizophrenia | DNM:Ambalavanan_2016 |
Differentially methylated gene
| Probe | Chromosome | Position | Nearest gene | P (dis) | Beta (dis) | FDR (dis) | Study |
|---|---|---|---|---|---|---|---|
| cg26063106 | 13 | 39261796 | FREM2 | 9.5E-11 | -0.012 | 4.49E-7 | DMG:Jaffe_2016 |
eQTL annotation
| SNP ID | Chromosome | Position | eGene | Gene Entrez ID | pvalue | qvalue | TSS distance | eQTL type |
|---|---|---|---|---|---|---|---|---|
| rs16843589 | chr4 | 2916930 | FREM2 | 341640 | 0.18 | trans | ||
| rs9548430 | 13 | 39277956 | FREM2 | ENSG00000150893.9 | 1.402E-6 | 0 | 16690 | gtex_brain_ba24 |
| rs9548438 | 13 | 39298288 | FREM2 | ENSG00000150893.9 | 2.54E-7 | 0 | 37022 | gtex_brain_ba24 |
| rs9532272 | 13 | 39306690 | FREM2 | ENSG00000150893.9 | 1.274E-8 | 0 | 45424 | gtex_brain_ba24 |
| rs9548446 | 13 | 39324093 | FREM2 | ENSG00000150893.9 | 1.213E-6 | 0 | 62827 | gtex_brain_ba24 |
| rs34692381 | 13 | 39331723 | FREM2 | ENSG00000150893.9 | 2.99E-8 | 0 | 70457 | gtex_brain_ba24 |
| rs9532275 | 13 | 39338062 | FREM2 | ENSG00000150893.9 | 1.812E-8 | 0 | 76796 | gtex_brain_ba24 |
| rs12020645 | 13 | 39341638 | FREM2 | ENSG00000150893.9 | 1.812E-8 | 0 | 80372 | gtex_brain_ba24 |
| rs9548450 | 13 | 39346192 | FREM2 | ENSG00000150893.9 | 1.811E-8 | 0 | 84926 | gtex_brain_ba24 |
| rs2496446 | 13 | 39301453 | FREM2 | ENSG00000150893.9 | 3.55E-7 | 0.01 | 40187 | gtex_brain_putamen_basal |
| rs2197887 | 13 | 39304279 | FREM2 | ENSG00000150893.9 | 3.675E-7 | 0.01 | 43013 | gtex_brain_putamen_basal |
| rs2442359 | 13 | 39304814 | FREM2 | ENSG00000150893.9 | 3.675E-7 | 0.01 | 43548 | gtex_brain_putamen_basal |
| rs2496448 | 13 | 39305383 | FREM2 | ENSG00000150893.9 | 3.675E-7 | 0.01 | 44117 | gtex_brain_putamen_basal |
| rs2496449 | 13 | 39305413 | FREM2 | ENSG00000150893.9 | 3.675E-7 | 0.01 | 44147 | gtex_brain_putamen_basal |
| rs9532272 | 13 | 39306690 | FREM2 | ENSG00000150893.9 | 7.835E-7 | 0.01 | 45424 | gtex_brain_putamen_basal |
| rs2496451 | 13 | 39307025 | FREM2 | ENSG00000150893.9 | 3.675E-7 | 0.01 | 45759 | gtex_brain_putamen_basal |
| rs9548443 | 13 | 39307884 | FREM2 | ENSG00000150893.9 | 3.683E-7 | 0.01 | 46618 | gtex_brain_putamen_basal |
| rs1037254 | 13 | 39320761 | FREM2 | ENSG00000150893.9 | 3.936E-6 | 0.01 | 59495 | gtex_brain_putamen_basal |
| rs9548446 | 13 | 39324093 | FREM2 | ENSG00000150893.9 | 7.169E-7 | 0.01 | 62827 | gtex_brain_putamen_basal |
| rs34692381 | 13 | 39331723 | FREM2 | ENSG00000150893.9 | 7.624E-8 | 0.01 | 70457 | gtex_brain_putamen_basal |
| rs9532275 | 13 | 39338062 | FREM2 | ENSG00000150893.9 | 7.858E-8 | 0.01 | 76796 | gtex_brain_putamen_basal |
| rs12020645 | 13 | 39341638 | FREM2 | ENSG00000150893.9 | 7.858E-8 | 0.01 | 80372 | gtex_brain_putamen_basal |
| rs9548450 | 13 | 39346192 | FREM2 | ENSG00000150893.9 | 7.977E-8 | 0.01 | 84926 | gtex_brain_putamen_basal |
Section II. Transcriptome annotation
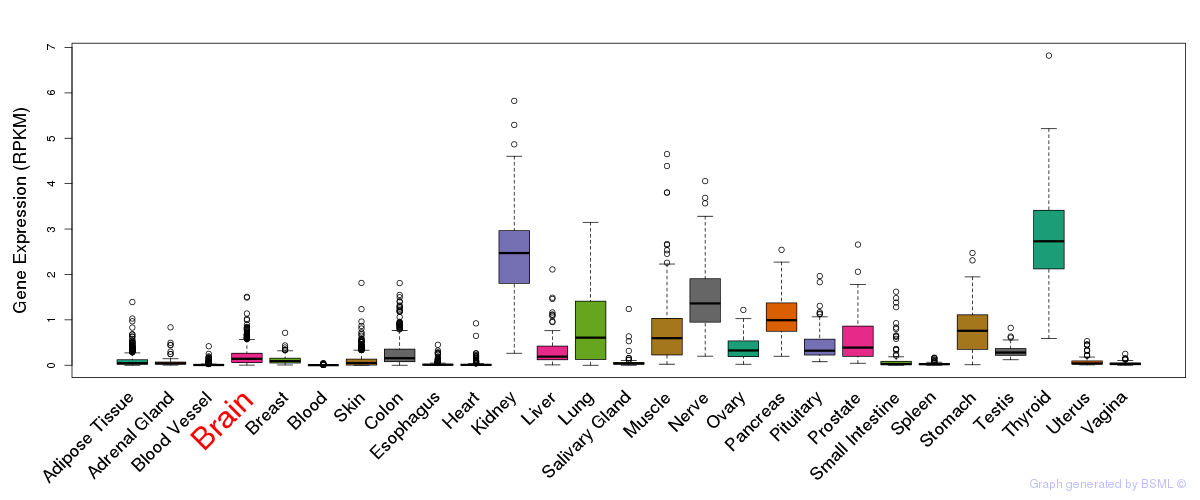
General gene expression (GTEx)
Gene expression during devlopment (BrainCloud)
Footnote:
A total of 269 time points ploted, with n=38 fetal samples (x=1:38). Each triangle represents one time point.
Gene expression of temporal and spatial changes (BrainSpan)
Footnote:
SC: sub-cortical regions; SM: sensory-motor regions; FC: frontal cortex; and TP: temporal-parietal cortex
ST1: fetal (13 - 26 postconception weeks), ST2: early infancy to late childhood (4 months to 11 years), and ST3: adolescence to adulthood (13 - 23 years)
The bar shown representes the lower 25% and upper 25% of the expression distribution.
No co-expressed genes in brain regions
Section III. Gene Ontology annotation
| Molecular function | GO term | Evidence | Neuro keywords | PubMed ID |
|---|---|---|---|---|
| GO:0005509 | calcium ion binding | IEA | - | |
| GO:0005515 | protein binding | IEA | - | |
| Biological process | GO term | Evidence | Neuro keywords | PubMed ID |
| GO:0007154 | cell communication | IEA | - | |
| GO:0007155 | cell adhesion | IEA | - | |
| GO:0007156 | homophilic cell adhesion | IEA | - | |
| GO:0007275 | multicellular organismal development | IEA | - | |
| Cellular component | GO term | Evidence | Neuro keywords | PubMed ID |
| GO:0016021 | integral to membrane | IEA | - | |
| GO:0005886 | plasma membrane | IEA | - |
Section V. Pathway annotation
| Pathway name | Pathway size | # SZGR 2.0 genes in pathway | Info |
|---|---|---|---|
| WATANABE COLON CANCER MSI VS MSS DN | 81 | 42 | All SZGR 2.0 genes in this pathway |
| CHEMNITZ RESPONSE TO PROSTAGLANDIN E2 DN | 391 | 222 | All SZGR 2.0 genes in this pathway |
| SENGUPTA NASOPHARYNGEAL CARCINOMA WITH LMP1 DN | 175 | 82 | All SZGR 2.0 genes in this pathway |
| CHARAFE BREAST CANCER LUMINAL VS MESENCHYMAL UP | 450 | 256 | All SZGR 2.0 genes in this pathway |
| WANG LMO4 TARGETS UP | 372 | 227 | All SZGR 2.0 genes in this pathway |
| SABATES COLORECTAL ADENOMA UP | 141 | 75 | All SZGR 2.0 genes in this pathway |
| CREIGHTON ENDOCRINE THERAPY RESISTANCE 1 | 528 | 324 | All SZGR 2.0 genes in this pathway |
| CREIGHTON ENDOCRINE THERAPY RESISTANCE 4 | 307 | 185 | All SZGR 2.0 genes in this pathway |
| MASSARWEH TAMOXIFEN RESISTANCE DN | 258 | 160 | All SZGR 2.0 genes in this pathway |
| IWANAGA CARCINOGENESIS BY KRAS PTEN UP | 181 | 112 | All SZGR 2.0 genes in this pathway |
| MEISSNER BRAIN HCP WITH H3K4ME3 AND H3K27ME3 | 1069 | 729 | All SZGR 2.0 genes in this pathway |
| DUTERTRE ESTRADIOL RESPONSE 24HR UP | 324 | 193 | All SZGR 2.0 genes in this pathway |
| PEDERSEN METASTASIS BY ERBB2 ISOFORM 4 | 110 | 66 | All SZGR 2.0 genes in this pathway |
| ZWANG TRANSIENTLY UP BY 2ND EGF PULSE ONLY | 1725 | 838 | All SZGR 2.0 genes in this pathway |
| NABA ECM AFFILIATED | 171 | 89 | All SZGR 2.0 genes in this pathway |
| NABA MATRISOME ASSOCIATED | 753 | 411 | All SZGR 2.0 genes in this pathway |
| NABA MATRISOME | 1028 | 559 | All SZGR 2.0 genes in this pathway |
Section VI. microRNA annotation
| miRNA family | Target position | miRNA ID | miRNA seq | ||
|---|---|---|---|---|---|
| UTR start | UTR end | Match method | |||
| miR-200bc/429 | 891 | 897 | m8 | hsa-miR-200b | UAAUACUGCCUGGUAAUGAUGAC |
| hsa-miR-200c | UAAUACUGCCGGGUAAUGAUGG | ||||
| hsa-miR-429 | UAAUACUGUCUGGUAAAACCGU | ||||
| miR-24 | 874 | 880 | m8 | hsa-miR-24SZ | UGGCUCAGUUCAGCAGGAACAG |
| miR-299-5p | 669 | 675 | 1A | hsa-miR-299-5p | UGGUUUACCGUCCCACAUACAU |
| miR-9 | 672 | 679 | 1A,m8 | hsa-miR-9SZ | UCUUUGGUUAUCUAGCUGUAUGA |
- SZ: miRNAs which differentially expressed in brain cortex of schizophrenia patients comparing with control samples using microarray. Click here to see the list of SZ related miRNAs.
- Brain: miRNAs which are expressed in brain based on miRNA microarray expression studies. Click here to see the list of brain related miRNAs.