Gene Page: IDUA
Summary ?
| GeneID | 3425 |
| Symbol | IDUA |
| Synonyms | IDA|MPS1 |
| Description | iduronidase, alpha-L- |
| Reference | MIM:252800|HGNC:HGNC:5391|Ensembl:ENSG00000127415|HPRD:02016|Vega:OTTHUMG00000088901 |
| Gene type | protein-coding |
| Map location | 4p16.3 |
| Pascal p-value | 0.522 |
| Sherlock p-value | 0.052 |
| Fetal beta | -0.165 |
| DMG | 2 (# studies) |
| eGene | Cerebellum |
Gene in Data Sources
| Gene set name | Method of gene set | Description | Info |
|---|---|---|---|
| CV:PGCnp | Genome-wide Association Study | GWAS | |
| DMG:Jaffe_2016 | Genome-wide DNA methylation analysis | This dataset includes 2,104 probes/CpGs associated with SZ patients (n=108) compared to 136 controls at Bonferroni-adjusted P < 0.05. | 2 |
| DMG:vanEijk_2014 | Genome-wide DNA methylation analysis | This dataset includes 432 differentially methylated CpG sites corresponding to 391 unique transcripts between schizophrenia patients (n=260) and unaffected controls (n=250). | 2 |
Section I. Genetics and epigenetics annotation
 Differentially methylated gene
| Probe | Chromosome | Position | Nearest gene | P (dis) | Beta (dis) | FDR (dis) | Study |
|---|---|---|---|---|---|---|---|
| cg15750461 | 4 | 991553 | IDUA | 9.25E-9 | -0.016 | 4.15E-6 | DMG:Jaffe_2016 |
| cg17952262 | 4 | 683240 | IDUA | 2.577E-4 | 4.396 | DMG:vanEijk_2014 |
Section II. Transcriptome annotation
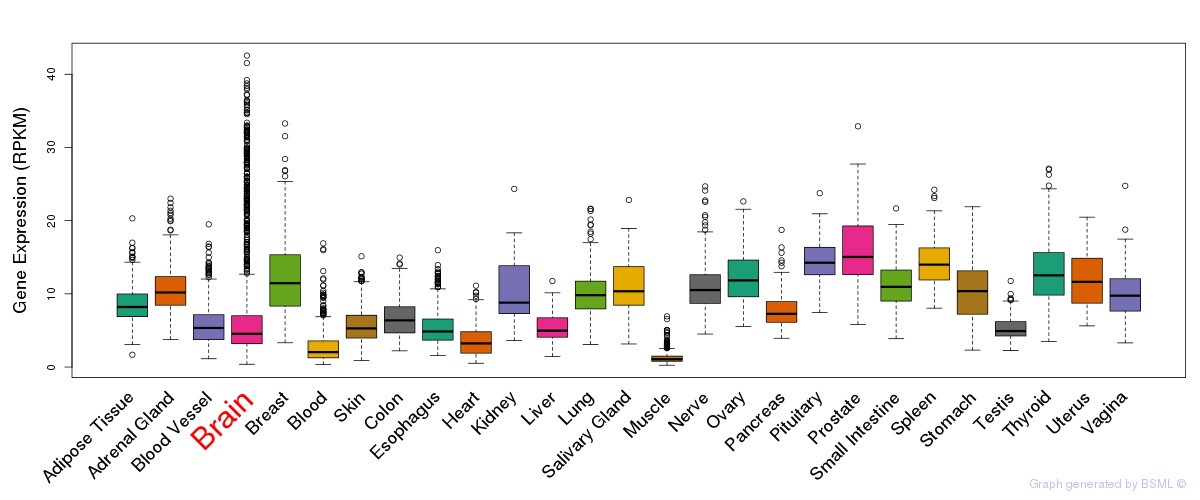
General gene expression (GTEx)
Gene expression during devlopment (BrainCloud)
Footnote:
A total of 269 time points ploted, with n=38 fetal samples (x=1:38). Each triangle represents one time point.
Gene expression of temporal and spatial changes (BrainSpan)
Footnote:
SC: sub-cortical regions; SM: sensory-motor regions; FC: frontal cortex; and TP: temporal-parietal cortex
ST1: fetal (13 - 26 postconception weeks), ST2: early infancy to late childhood (4 months to 11 years), and ST3: adolescence to adulthood (13 - 23 years)
The bar shown representes the lower 25% and upper 25% of the expression distribution.
No co-expressed genes in brain regions
Section V. Pathway annotation
| Pathway name | Pathway size | # SZGR 2.0 genes in pathway | Info |
|---|---|---|---|
| KEGG GLYCOSAMINOGLYCAN DEGRADATION | 21 | 14 | All SZGR 2.0 genes in this pathway |
| KEGG LYSOSOME | 121 | 83 | All SZGR 2.0 genes in this pathway |
| REACTOME HS GAG DEGRADATION | 20 | 15 | All SZGR 2.0 genes in this pathway |
| REACTOME CS DS DEGRADATION | 12 | 9 | All SZGR 2.0 genes in this pathway |
| REACTOME CHONDROITIN SULFATE DERMATAN SULFATE METABOLISM | 49 | 33 | All SZGR 2.0 genes in this pathway |
| REACTOME HEPARAN SULFATE HEPARIN HS GAG METABOLISM | 52 | 33 | All SZGR 2.0 genes in this pathway |
| REACTOME GLYCOSAMINOGLYCAN METABOLISM | 111 | 69 | All SZGR 2.0 genes in this pathway |
| REACTOME METABOLISM OF CARBOHYDRATES | 247 | 154 | All SZGR 2.0 genes in this pathway |
| CASORELLI ACUTE PROMYELOCYTIC LEUKEMIA UP | 177 | 110 | All SZGR 2.0 genes in this pathway |
| VECCHI GASTRIC CANCER EARLY DN | 367 | 220 | All SZGR 2.0 genes in this pathway |
| GRAESSMANN APOPTOSIS BY DOXORUBICIN UP | 1142 | 669 | All SZGR 2.0 genes in this pathway |
| GRAESSMANN RESPONSE TO MC AND DOXORUBICIN UP | 612 | 367 | All SZGR 2.0 genes in this pathway |
| PEREZ TP53 TARGETS | 1174 | 695 | All SZGR 2.0 genes in this pathway |
| PUJANA ATM PCC NETWORK | 1442 | 892 | All SZGR 2.0 genes in this pathway |
| TARTE PLASMA CELL VS PLASMABLAST UP | 398 | 262 | All SZGR 2.0 genes in this pathway |
| POMEROY MEDULLOBLASTOMA PROGNOSIS UP | 47 | 30 | All SZGR 2.0 genes in this pathway |
| WONG IFNA2 RESISTANCE DN | 34 | 20 | All SZGR 2.0 genes in this pathway |
| BROWNE HCMV INFECTION 48HR DN | 504 | 323 | All SZGR 2.0 genes in this pathway |
| MONNIER POSTRADIATION TUMOR ESCAPE DN | 373 | 196 | All SZGR 2.0 genes in this pathway |
| ZHANG BREAST CANCER PROGENITORS UP | 425 | 253 | All SZGR 2.0 genes in this pathway |
| HOFFMANN LARGE TO SMALL PRE BII LYMPHOCYTE DN | 72 | 47 | All SZGR 2.0 genes in this pathway |
| BOYAULT LIVER CANCER SUBCLASS G1 UP | 113 | 70 | All SZGR 2.0 genes in this pathway |
| RAO BOUND BY SALL4 ISOFORM B | 517 | 302 | All SZGR 2.0 genes in this pathway |