Gene Page: IMPG1
Summary ?
| GeneID | 3617 |
| Symbol | IMPG1 |
| Synonyms | GP147|IPM150|SPACR|VMD4 |
| Description | interphotoreceptor matrix proteoglycan 1 |
| Reference | MIM:602870|HGNC:HGNC:6055|Ensembl:ENSG00000112706|HPRD:04186|Vega:OTTHUMG00000015063 |
| Gene type | protein-coding |
| Map location | 6q14.2-q15 |
| Pascal p-value | 0.575 |
| DMG | 1 (# studies) |
Gene in Data Sources
| Gene set name | Method of gene set | Description | Info |
|---|---|---|---|
| CV:PGCnp | Genome-wide Association Study | GWAS | |
| DMG:Wockner_2014 | Genome-wide DNA methylation analysis | This dataset includes 4641 differentially methylated probes corresponding to 2929 unique genes between schizophrenia patients (n=24) and controls (n=24). | 1 |
Section I. Genetics and epigenetics annotation
 Differentially methylated gene
| Probe | Chromosome | Position | Nearest gene | P (dis) | Beta (dis) | FDR (dis) | Study |
|---|---|---|---|---|---|---|---|
| cg12602851 | 6 | 76644222 | IMPG1 | 5.533E-4 | 0.467 | 0.049 | DMG:Wockner_2014 |
Section II. Transcriptome annotation
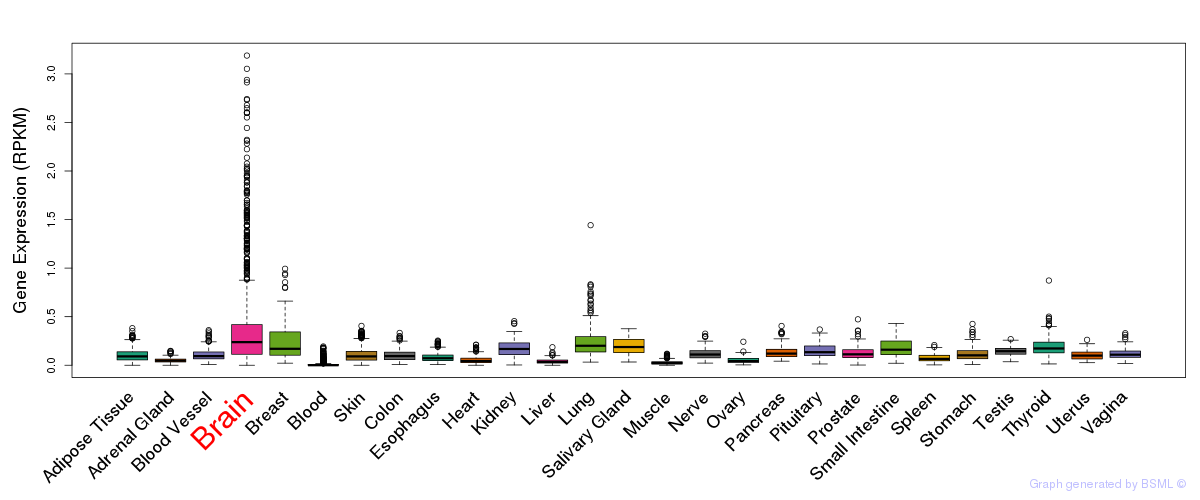
General gene expression (GTEx)
Gene expression of temporal and spatial changes (BrainSpan)
Footnote:
SC: sub-cortical regions; SM: sensory-motor regions; FC: frontal cortex; and TP: temporal-parietal cortex
ST1: fetal (13 - 26 postconception weeks), ST2: early infancy to late childhood (4 months to 11 years), and ST3: adolescence to adulthood (13 - 23 years)
The bar shown representes the lower 25% and upper 25% of the expression distribution.
Top co-expressed genes in brain regions
| Top 10 positively co-expressed genes | ||
| Gene | Pearson's Correlation | Spearman's Correlation |
| GAS1 | 0.88 | 0.77 |
| HES6 | 0.87 | 0.67 |
| CREB3L4 | 0.86 | 0.71 |
| CBX2 | 0.86 | 0.79 |
| NXN | 0.83 | 0.77 |
| C21orf45 | 0.83 | 0.89 |
| MCM7 | 0.83 | 0.74 |
| FOXN4 | 0.83 | 0.77 |
| RCOR2 | 0.82 | 0.90 |
| PHF21B | 0.82 | 0.82 |
| Top 10 negatively co-expressed genes | ||
| Gene | Pearson's Correlation | Spearman's Correlation |
| C5orf53 | -0.48 | -0.75 |
| AIFM3 | -0.47 | -0.74 |
| HLA-F | -0.47 | -0.72 |
| PTH1R | -0.46 | -0.68 |
| FBXO2 | -0.46 | -0.56 |
| ALDOC | -0.46 | -0.66 |
| S100B | -0.46 | -0.81 |
| LDHD | -0.45 | -0.58 |
| TINAGL1 | -0.45 | -0.69 |
| AF347015.27 | -0.45 | -0.84 |
Section III. Gene Ontology annotation
| Molecular function | GO term | Evidence | Neuro keywords | PubMed ID |
|---|---|---|---|---|
| GO:0004872 | receptor activity | IEA | - | |
| GO:0005201 | extracellular matrix structural constituent | TAS | 9691169 | |
| Biological process | GO term | Evidence | Neuro keywords | PubMed ID |
| GO:0007601 | visual perception | TAS | 9691169 | |
| Cellular component | GO term | Evidence | Neuro keywords | PubMed ID |
| GO:0005576 | extracellular region | IEA | - | |
| GO:0005578 | proteinaceous extracellular matrix | TAS | 9691169 |
Section V. Pathway annotation
| Pathway name | Pathway size | # SZGR 2.0 genes in pathway | Info |
|---|---|---|---|
| YAGI AML WITH T 9 11 TRANSLOCATION | 130 | 87 | All SZGR 2.0 genes in this pathway |
| YAGI AML WITH 11Q23 REARRANGED | 351 | 238 | All SZGR 2.0 genes in this pathway |
| NABA PROTEOGLYCANS | 35 | 23 | All SZGR 2.0 genes in this pathway |
| NABA CORE MATRISOME | 275 | 148 | All SZGR 2.0 genes in this pathway |
| NABA MATRISOME | 1028 | 559 | All SZGR 2.0 genes in this pathway |
Section VI. microRNA annotation
| miRNA family | Target position | miRNA ID | miRNA seq | ||
|---|---|---|---|---|---|
| UTR start | UTR end | Match method | |||
| miR-181 | 452 | 459 | 1A,m8 | hsa-miR-181abrain | AACAUUCAACGCUGUCGGUGAGU |
| hsa-miR-181bSZ | AACAUUCAUUGCUGUCGGUGGG | ||||
| hsa-miR-181cbrain | AACAUUCAACCUGUCGGUGAGU | ||||
| hsa-miR-181dbrain | AACAUUCAUUGUUGUCGGUGGGUU | ||||
- SZ: miRNAs which differentially expressed in brain cortex of schizophrenia patients comparing with control samples using microarray. Click here to see the list of SZ related miRNAs.
- Brain: miRNAs which are expressed in brain based on miRNA microarray expression studies. Click here to see the list of brain related miRNAs.