Gene Page: INPP4A
Summary ?
| GeneID | 3631 |
| Symbol | INPP4A |
| Synonyms | INPP4|TVAS1 |
| Description | inositol polyphosphate-4-phosphatase type I A |
| Reference | MIM:600916|HGNC:HGNC:6074|Ensembl:ENSG00000040933|HPRD:02949|Vega:OTTHUMG00000153106 |
| Gene type | protein-coding |
| Map location | 2q11.2 |
| Pascal p-value | 0.034 |
| Fetal beta | -0.656 |
| DMG | 1 (# studies) |
| eGene | Cerebellar Hemisphere |
| Support | INTRACELLULAR SIGNAL TRANSDUCTION G2Cdb.humanPSD G2Cdb.humanPSP CompositeSet Darnell FMRP targets |
Gene in Data Sources
| Gene set name | Method of gene set | Description | Info |
|---|---|---|---|
| CV:GWASdb | Genome-wide Association Studies | GWASdb records for schizophrenia | |
| CV:PGCnp | Genome-wide Association Study | GWAS | |
| DMG:Wockner_2014 | Genome-wide DNA methylation analysis | This dataset includes 4641 differentially methylated probes corresponding to 2929 unique genes between schizophrenia patients (n=24) and controls (n=24). | 1 |
| GSMA_I | Genome scan meta-analysis | Psr: 0.0004 |
Section I. Genetics and epigenetics annotation
 DNM table
| Gene | Chromosome | Position | Ref | Alt | Transcript | AA change | Mutation type | Sift | CG46 | Trait | Study |
|---|---|---|---|---|---|---|---|---|---|---|---|
| INPP4A | chr2 | 99163059 | C | T | NM_001134224 NM_001134225 NM_001566 NM_004027 | . . . . | silent silent silent silent | Schizophrenia | DNM:Fromer_2014 |
Differentially methylated gene
| Probe | Chromosome | Position | Nearest gene | P (dis) | Beta (dis) | FDR (dis) | Study |
|---|---|---|---|---|---|---|---|
| cg04135372 | 2 | 99061383 | INPP4A | 4.73E-5 | -0.253 | 0.021 | DMG:Wockner_2014 |
Section II. Transcriptome annotation
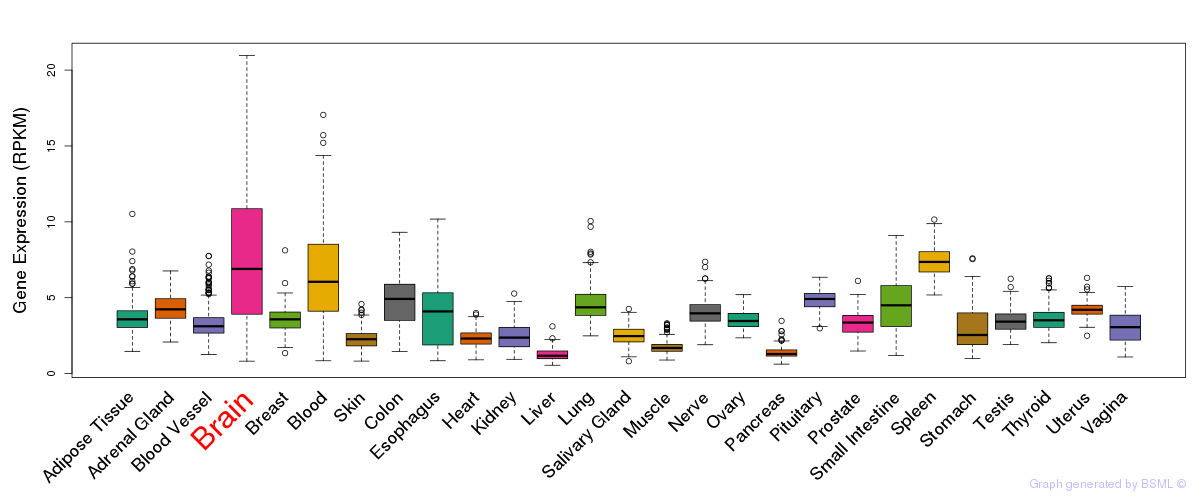
General gene expression (GTEx)
Gene expression during devlopment (BrainCloud)
Footnote:
A total of 269 time points ploted, with n=38 fetal samples (x=1:38). Each triangle represents one time point.
Gene expression of temporal and spatial changes (BrainSpan)
Footnote:
SC: sub-cortical regions; SM: sensory-motor regions; FC: frontal cortex; and TP: temporal-parietal cortex
ST1: fetal (13 - 26 postconception weeks), ST2: early infancy to late childhood (4 months to 11 years), and ST3: adolescence to adulthood (13 - 23 years)
The bar shown representes the lower 25% and upper 25% of the expression distribution.
Top co-expressed genes in brain regions
| Top 10 positively co-expressed genes | ||
| Gene | Pearson's Correlation | Spearman's Correlation |
| C9orf125 | 0.80 | 0.81 |
| KCTD2 | 0.74 | 0.77 |
| DNAJC6 | 0.74 | 0.80 |
| TNFRSF21 | 0.74 | 0.80 |
| TBC1D9 | 0.73 | 0.74 |
| CLCN6 | 0.73 | 0.78 |
| CD83 | 0.73 | 0.71 |
| MPP2 | 0.72 | 0.77 |
| SLC9A6 | 0.72 | 0.75 |
| SNAP91 | 0.72 | 0.78 |
| Top 10 negatively co-expressed genes | ||
| Gene | Pearson's Correlation | Spearman's Correlation |
| AF347015.21 | -0.54 | -0.56 |
| AF347015.31 | -0.50 | -0.51 |
| C1orf61 | -0.50 | -0.64 |
| MT-CO2 | -0.50 | -0.52 |
| C1orf54 | -0.50 | -0.59 |
| ACSF2 | -0.50 | -0.57 |
| GNG11 | -0.50 | -0.57 |
| SAT1 | -0.49 | -0.57 |
| AF347015.8 | -0.48 | -0.49 |
| AP002478.3 | -0.48 | -0.53 |
Section III. Gene Ontology annotation
| Molecular function | GO term | Evidence | Neuro keywords | PubMed ID |
|---|---|---|---|---|
| GO:0016787 | hydrolase activity | IEA | - | |
| GO:0016316 | phosphatidylinositol-3,4-bisphosphate 4-phosphatase activity | IEA | - | |
| GO:0034597 | phosphatidyl-inositol-4,5-bisphosphate 4-phosphatase activity | IEA | - | |
| Biological process | GO term | Evidence | Neuro keywords | PubMed ID |
| GO:0007165 | signal transduction | TAS | 7608176 |
Section V. Pathway annotation
| Pathway name | Pathway size | # SZGR 2.0 genes in pathway | Info |
|---|---|---|---|
| KEGG INOSITOL PHOSPHATE METABOLISM | 54 | 42 | All SZGR 2.0 genes in this pathway |
| KEGG PHOSPHATIDYLINOSITOL SIGNALING SYSTEM | 76 | 56 | All SZGR 2.0 genes in this pathway |
| SENGUPTA NASOPHARYNGEAL CARCINOMA UP | 294 | 178 | All SZGR 2.0 genes in this pathway |
| DODD NASOPHARYNGEAL CARCINOMA DN | 1375 | 806 | All SZGR 2.0 genes in this pathway |
| HAHTOLA MYCOSIS FUNGOIDES CD4 DN | 116 | 71 | All SZGR 2.0 genes in this pathway |
| PEREZ TP53 TARGETS | 1174 | 695 | All SZGR 2.0 genes in this pathway |
| PUJANA ATM PCC NETWORK | 1442 | 892 | All SZGR 2.0 genes in this pathway |
| BENPORATH NANOG TARGETS | 988 | 594 | All SZGR 2.0 genes in this pathway |
| BENPORATH EED TARGETS | 1062 | 725 | All SZGR 2.0 genes in this pathway |
| SHEPARD BMYB MORPHOLINO DN | 200 | 112 | All SZGR 2.0 genes in this pathway |
| LU AGING BRAIN DN | 153 | 120 | All SZGR 2.0 genes in this pathway |
| CUI TCF21 TARGETS 2 DN | 830 | 547 | All SZGR 2.0 genes in this pathway |
| EHRLICH ICF SYNDROM DN | 15 | 13 | All SZGR 2.0 genes in this pathway |
| CREIGHTON ENDOCRINE THERAPY RESISTANCE 5 | 482 | 296 | All SZGR 2.0 genes in this pathway |
| FIRESTEIN PROLIFERATION | 175 | 125 | All SZGR 2.0 genes in this pathway |
| LEE DIFFERENTIATING T LYMPHOCYTE | 200 | 115 | All SZGR 2.0 genes in this pathway |
Section VI. microRNA annotation
| miRNA family | Target position | miRNA ID | miRNA seq | ||
|---|---|---|---|---|---|
| UTR start | UTR end | Match method | |||
| miR-205 | 81 | 87 | 1A | hsa-miR-205 | UCCUUCAUUCCACCGGAGUCUG |
- SZ: miRNAs which differentially expressed in brain cortex of schizophrenia patients comparing with control samples using microarray. Click here to see the list of SZ related miRNAs.
- Brain: miRNAs which are expressed in brain based on miRNA microarray expression studies. Click here to see the list of brain related miRNAs.