Gene Page: IREB2
Summary ?
| GeneID | 3658 |
| Symbol | IREB2 |
| Synonyms | ACO3|IRP2|IRP2AD |
| Description | iron responsive element binding protein 2 |
| Reference | MIM:147582|HGNC:HGNC:6115|Ensembl:ENSG00000136381|HPRD:08858|Vega:OTTHUMG00000143861 |
| Gene type | protein-coding |
| Map location | 15q25.1 |
| Pascal p-value | 1.749E-7 |
| Fetal beta | 1.419 |
| eGene | Myers' cis & trans |
Gene in Data Sources
| Gene set name | Method of gene set | Description | Info |
|---|---|---|---|
| CV:PGCnp | Genome-wide Association Study | GWAS | |
| CV:PheWAS | Phenome-wide association studies (PheWAS) | 157 SNPs associated with schizophrenia | 1 |
Section I. Genetics and epigenetics annotation
 CV:PheWAS
| SNP ID | Chromosome | Position | Allele | P | Function | Gene | Up/Down Distance |
|---|---|---|---|---|---|---|---|
| rs13180 | 15 | 78789488 | null | 1.499 | IREB2 | null |
eQTL annotation
| SNP ID | Chromosome | Position | eGene | Gene Entrez ID | pvalue | qvalue | TSS distance | eQTL type |
|---|---|---|---|---|---|---|---|---|
| rs7370564 | 0 | IREB2 | 3658 | 0.05 | trans |
Section II. Transcriptome annotation
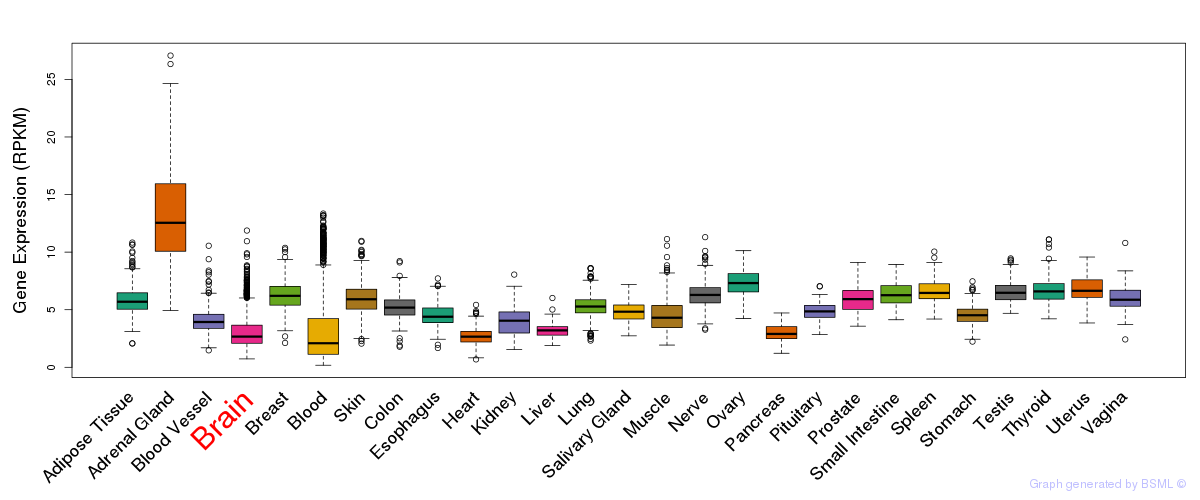
General gene expression (GTEx)
Gene expression during devlopment (BrainCloud)
Footnote:
A total of 269 time points ploted, with n=38 fetal samples (x=1:38). Each triangle represents one time point.
Gene expression of temporal and spatial changes (BrainSpan)
Footnote:
SC: sub-cortical regions; SM: sensory-motor regions; FC: frontal cortex; and TP: temporal-parietal cortex
ST1: fetal (13 - 26 postconception weeks), ST2: early infancy to late childhood (4 months to 11 years), and ST3: adolescence to adulthood (13 - 23 years)
The bar shown representes the lower 25% and upper 25% of the expression distribution.
Top co-expressed genes in brain regions
| Top 10 positively co-expressed genes | ||
| Gene | Pearson's Correlation | Spearman's Correlation |
| DOCK2 | 0.69 | 0.59 |
| ITGB2 | 0.69 | 0.62 |
| CD4 | 0.66 | 0.64 |
| DEF6 | 0.65 | 0.59 |
| WDFY4 | 0.64 | 0.60 |
| PTPN6 | 0.63 | 0.57 |
| APBB1IP | 0.63 | 0.56 |
| CSF1R | 0.63 | 0.60 |
| CSF3R | 0.63 | 0.54 |
| BIN2 | 0.62 | 0.61 |
| Top 10 negatively co-expressed genes | ||
| Gene | Pearson's Correlation | Spearman's Correlation |
| C8orf59 | -0.31 | -0.34 |
| AC087071.1 | -0.30 | -0.33 |
| NDUFAF2 | -0.29 | -0.36 |
| RPL31 | -0.28 | -0.38 |
| PFDN5 | -0.27 | -0.35 |
| PFDN4 | -0.27 | -0.35 |
| ST20 | -0.27 | -0.34 |
| COMMD3 | -0.26 | -0.28 |
| ZNF32 | -0.26 | -0.32 |
| RPS7 | -0.26 | -0.34 |
Section V. Pathway annotation
| Pathway name | Pathway size | # SZGR 2.0 genes in pathway | Info |
|---|---|---|---|
| PID MYC ACTIV PATHWAY | 79 | 62 | All SZGR 2.0 genes in this pathway |
| HOOI ST7 TARGETS DN | 123 | 78 | All SZGR 2.0 genes in this pathway |
| OSMAN BLADDER CANCER DN | 406 | 230 | All SZGR 2.0 genes in this pathway |
| SENESE HDAC3 TARGETS DN | 536 | 332 | All SZGR 2.0 genes in this pathway |
| TANAKA METHYLATED IN ESOPHAGEAL CARCINOMA | 103 | 58 | All SZGR 2.0 genes in this pathway |
| MOREAUX B LYMPHOCYTE MATURATION BY TACI DN | 73 | 45 | All SZGR 2.0 genes in this pathway |
| MOREAUX MULTIPLE MYELOMA BY TACI DN | 172 | 107 | All SZGR 2.0 genes in this pathway |
| BROWNE HCMV INFECTION 20HR UP | 240 | 152 | All SZGR 2.0 genes in this pathway |
| BROWNE HCMV INFECTION 16HR UP | 225 | 139 | All SZGR 2.0 genes in this pathway |
| DEBIASI APOPTOSIS BY REOVIRUS INFECTION UP | 314 | 201 | All SZGR 2.0 genes in this pathway |
| BURTON ADIPOGENESIS 12 | 36 | 18 | All SZGR 2.0 genes in this pathway |
| DOUGLAS BMI1 TARGETS DN | 314 | 188 | All SZGR 2.0 genes in this pathway |
| KONDO PROSTATE CANCER HCP WITH H3K27ME3 | 97 | 72 | All SZGR 2.0 genes in this pathway |
| STEARMAN LUNG CANCER EARLY VS LATE UP | 125 | 89 | All SZGR 2.0 genes in this pathway |
| FUJII YBX1 TARGETS DN | 202 | 132 | All SZGR 2.0 genes in this pathway |
| BAE BRCA1 TARGETS DN | 32 | 27 | All SZGR 2.0 genes in this pathway |
| GABRIELY MIR21 TARGETS | 289 | 187 | All SZGR 2.0 genes in this pathway |
| BRUINS UVC RESPONSE VIA TP53 GROUP A | 898 | 516 | All SZGR 2.0 genes in this pathway |
| PURBEY TARGETS OF CTBP1 NOT SATB1 UP | 344 | 215 | All SZGR 2.0 genes in this pathway |