Gene Page: STT3A
Summary ?
| GeneID | 3703 |
| Symbol | STT3A |
| Synonyms | ITM1|STT3-A|TMC |
| Description | STT3A, catalytic subunit of the oligosaccharyltransferase complex |
| Reference | MIM:601134|HGNC:HGNC:6172|Ensembl:ENSG00000134910|HPRD:03086|Vega:OTTHUMG00000165852 |
| Gene type | protein-coding |
| Map location | 11q23.3 |
| Pascal p-value | 0.005 |
| Sherlock p-value | 0.206 |
| Fetal beta | 0.372 |
| DMG | 1 (# studies) |
| eGene | Myers' cis & trans |
Gene in Data Sources
| Gene set name | Method of gene set | Description | Info |
|---|---|---|---|
| CV:PGCnp | Genome-wide Association Study | GWAS | |
| DMG:Nishioka_2013 | Genome-wide DNA methylation analysis | The authors investigated the methylation profiles of DNA in peripheral blood cells from 18 patients with first-episode schizophrenia (FESZ) and from 15 normal controls. | 1 |
| PMID:cooccur | High-throughput literature-search | Systematic search in PubMed for genes co-occurring with SCZ keywords. A total of 3027 genes were included. | |
| Literature | High-throughput literature-search | Co-occurance with Schizophrenia keywords: schizophrenia,schizophrenias | Click to show details |
Section I. Genetics and epigenetics annotation
 Differentially methylated gene
| Probe | Chromosome | Position | Nearest gene | P (dis) | Beta (dis) | FDR (dis) | Study |
|---|---|---|---|---|---|---|---|
| cg06567423 | 11 | 125462867 | STT3A | -0.019 | 0.37 | DMG:Nishioka_2013 |
eQTL annotation
| SNP ID | Chromosome | Position | eGene | Gene Entrez ID | pvalue | qvalue | TSS distance | eQTL type |
|---|---|---|---|---|---|---|---|---|
| rs6586487 | chr1 | 18339747 | STT3A | 3703 | 0.12 | trans | ||
| rs17472583 | chr1 | 18340024 | STT3A | 3703 | 0.13 | trans |
Section II. Transcriptome annotation
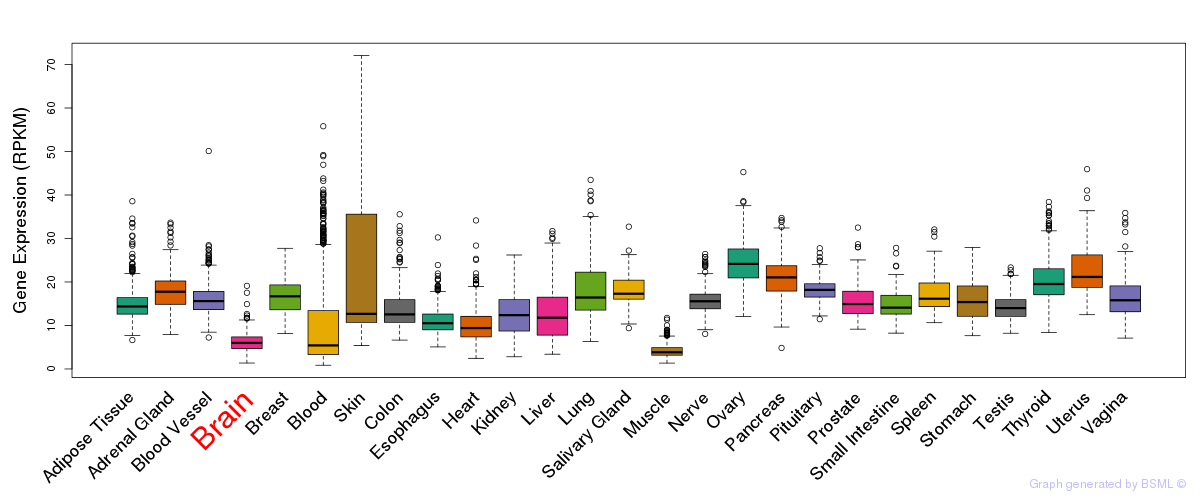
General gene expression (GTEx)
Gene expression during devlopment (BrainCloud)
Footnote:
A total of 269 time points ploted, with n=38 fetal samples (x=1:38). Each triangle represents one time point.
Gene expression of temporal and spatial changes (BrainSpan)
Footnote:
SC: sub-cortical regions; SM: sensory-motor regions; FC: frontal cortex; and TP: temporal-parietal cortex
ST1: fetal (13 - 26 postconception weeks), ST2: early infancy to late childhood (4 months to 11 years), and ST3: adolescence to adulthood (13 - 23 years)
The bar shown representes the lower 25% and upper 25% of the expression distribution.
Top co-expressed genes in brain regions
| Top 10 positively co-expressed genes | ||
| Gene | Pearson's Correlation | Spearman's Correlation |
| CSK | 0.95 | 0.92 |
| WDR6 | 0.95 | 0.94 |
| GMIP | 0.95 | 0.89 |
| C6orf134 | 0.95 | 0.89 |
| DPYSL5 | 0.95 | 0.93 |
| CSNK1E | 0.95 | 0.90 |
| KDM2B | 0.94 | 0.89 |
| C2orf24 | 0.94 | 0.91 |
| CCDC120 | 0.94 | 0.91 |
| DPYSL3 | 0.94 | 0.89 |
| Top 10 negatively co-expressed genes | ||
| Gene | Pearson's Correlation | Spearman's Correlation |
| C5orf53 | -0.74 | -0.77 |
| HLA-F | -0.73 | -0.72 |
| AIFM3 | -0.72 | -0.68 |
| FBXO2 | -0.70 | -0.60 |
| ALDOC | -0.70 | -0.63 |
| S100B | -0.70 | -0.76 |
| AF347015.31 | -0.70 | -0.85 |
| AF347015.27 | -0.70 | -0.83 |
| CA4 | -0.69 | -0.72 |
| ACOT13 | -0.69 | -0.72 |
Section V. Pathway annotation
| Pathway name | Pathway size | # SZGR 2.0 genes in pathway | Info |
|---|---|---|---|
| KEGG N GLYCAN BIOSYNTHESIS | 46 | 31 | All SZGR 2.0 genes in this pathway |
| REACTOME METABOLISM OF PROTEINS | 518 | 242 | All SZGR 2.0 genes in this pathway |
| REACTOME POST TRANSLATIONAL PROTEIN MODIFICATION | 188 | 116 | All SZGR 2.0 genes in this pathway |
| REACTOME ASPARAGINE N LINKED GLYCOSYLATION | 81 | 54 | All SZGR 2.0 genes in this pathway |
| CASORELLI ACUTE PROMYELOCYTIC LEUKEMIA DN | 663 | 425 | All SZGR 2.0 genes in this pathway |
| ENK UV RESPONSE KERATINOCYTE DN | 485 | 334 | All SZGR 2.0 genes in this pathway |
| LASTOWSKA NEUROBLASTOMA COPY NUMBER DN | 800 | 473 | All SZGR 2.0 genes in this pathway |
| SCHLOSSER SERUM RESPONSE DN | 712 | 443 | All SZGR 2.0 genes in this pathway |
| SHETH LIVER CANCER VS TXNIP LOSS PAM2 | 153 | 102 | All SZGR 2.0 genes in this pathway |
| SPIELMAN LYMPHOBLAST EUROPEAN VS ASIAN UP | 479 | 299 | All SZGR 2.0 genes in this pathway |
| PASQUALUCCI LYMPHOMA BY GC STAGE UP | 283 | 177 | All SZGR 2.0 genes in this pathway |
| MORI PLASMA CELL UP | 51 | 29 | All SZGR 2.0 genes in this pathway |
| TARTE PLASMA CELL VS B LYMPHOCYTE UP | 78 | 51 | All SZGR 2.0 genes in this pathway |
| GOLDRATH HOMEOSTATIC PROLIFERATION | 171 | 102 | All SZGR 2.0 genes in this pathway |
| BYSTRYKH HEMATOPOIESIS STEM CELL QTL TRANS | 882 | 572 | All SZGR 2.0 genes in this pathway |
| WANG CISPLATIN RESPONSE AND XPC UP | 202 | 115 | All SZGR 2.0 genes in this pathway |
| ACEVEDO LIVER TUMOR VS NORMAL ADJACENT TISSUE UP | 863 | 514 | All SZGR 2.0 genes in this pathway |
| QI PLASMACYTOMA DN | 100 | 63 | All SZGR 2.0 genes in this pathway |
| MILI PSEUDOPODIA CHEMOTAXIS DN | 457 | 302 | All SZGR 2.0 genes in this pathway |
| MILI PSEUDOPODIA HAPTOTAXIS DN | 668 | 419 | All SZGR 2.0 genes in this pathway |
| BOYAULT LIVER CANCER SUBCLASS G1 UP | 113 | 70 | All SZGR 2.0 genes in this pathway |
| CHIANG LIVER CANCER SUBCLASS UNANNOTATED DN | 193 | 112 | All SZGR 2.0 genes in this pathway |
| JOHNSTONE PARVB TARGETS 3 DN | 918 | 550 | All SZGR 2.0 genes in this pathway |
| BRUINS UVC RESPONSE VIA TP53 GROUP D | 280 | 158 | All SZGR 2.0 genes in this pathway |