Gene Page: PNPLA7
Summary ?
| GeneID | 375775 |
| Symbol | PNPLA7 |
| Synonyms | C9orf111|NTE-R1|NTEL1 |
| Description | patatin like phospholipase domain containing 7 |
| Reference | MIM:612122|HGNC:HGNC:24768|Ensembl:ENSG00000130653|HPRD:12933|Vega:OTTHUMG00000020990 |
| Gene type | protein-coding |
| Map location | 9q34.3 |
| Pascal p-value | 0.266 |
| Sherlock p-value | 0.356 |
| Fetal beta | -0.599 |
| DMG | 1 (# studies) |
| eGene | Caudate basal ganglia Cerebellar Hemisphere Cerebellum Cortex Frontal Cortex BA9 Putamen basal ganglia Myers' cis & trans Meta |
Gene in Data Sources
| Gene set name | Method of gene set | Description | Info |
|---|---|---|---|
| CV:PGCnp | Genome-wide Association Study | GWAS | |
| DMG:vanEijk_2014 | Genome-wide DNA methylation analysis | This dataset includes 432 differentially methylated CpG sites corresponding to 391 unique transcripts between schizophrenia patients (n=260) and unaffected controls (n=250). | 2 |
| DMG:Wockner_2014 | Genome-wide DNA methylation analysis | This dataset includes 4641 differentially methylated probes corresponding to 2929 unique genes between schizophrenia patients (n=24) and controls (n=24). | 2 |
Section I. Genetics and epigenetics annotation
 Differentially methylated gene
| Probe | Chromosome | Position | Nearest gene | P (dis) | Beta (dis) | FDR (dis) | Study |
|---|---|---|---|---|---|---|---|
| cg01111842 | 9 | 140444966 | PNPLA7;MRPL41 | 3.62E-5 | -0.273 | 0.02 | DMG:Wockner_2014 |
| cg17959722 | 9 | 140446823 | PNPLA7 | 8.51E-5 | -3.253 | DMG:vanEijk_2014 |
eQTL annotation
| SNP ID | Chromosome | Position | eGene | Gene Entrez ID | pvalue | qvalue | TSS distance | eQTL type |
|---|---|---|---|---|---|---|---|---|
| rs9288129 | chr2 | 187302875 | PNPLA7 | 375775 | 0.08 | trans | ||
| rs10497671 | chr2 | 187374602 | PNPLA7 | 375775 | 0.11 | trans | ||
| rs10497672 | 0 | PNPLA7 | 375775 | 0.01 | trans | |||
| rs2254149 | 9 | 140441177 | PNPLA7 | ENSG00000130653.11 | 6.36237E-7 | 0.01 | 3809 | gtex_brain_putamen_basal |
| rs10746563 | 9 | 140444078 | PNPLA7 | ENSG00000130653.11 | 1.42294E-6 | 0.01 | 908 | gtex_brain_putamen_basal |
Section II. Transcriptome annotation
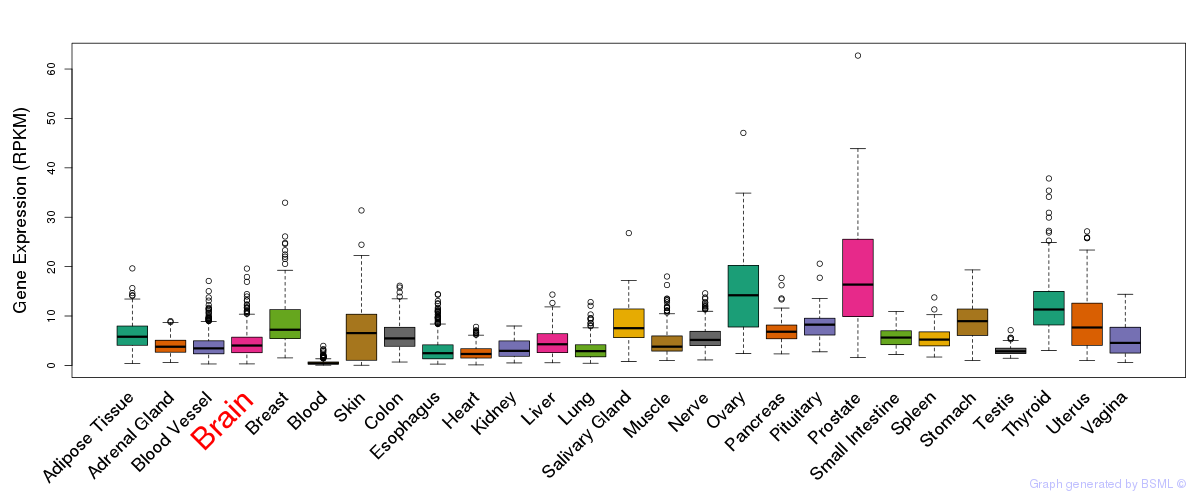
General gene expression (GTEx)
Gene expression during devlopment (BrainCloud)
Footnote:
A total of 269 time points ploted, with n=38 fetal samples (x=1:38). Each triangle represents one time point.
Gene expression of temporal and spatial changes (BrainSpan)
Footnote:
SC: sub-cortical regions; SM: sensory-motor regions; FC: frontal cortex; and TP: temporal-parietal cortex
ST1: fetal (13 - 26 postconception weeks), ST2: early infancy to late childhood (4 months to 11 years), and ST3: adolescence to adulthood (13 - 23 years)
The bar shown representes the lower 25% and upper 25% of the expression distribution.
No co-expressed genes in brain regions
Section V. Pathway annotation
| Pathway name | Pathway size | # SZGR 2.0 genes in pathway | Info |
|---|---|---|---|
| KOYAMA SEMA3B TARGETS UP | 292 | 168 | All SZGR 2.0 genes in this pathway |
| ROZANOV MMP14 TARGETS UP | 266 | 171 | All SZGR 2.0 genes in this pathway |
| WENG POR TARGETS LIVER DN | 20 | 11 | All SZGR 2.0 genes in this pathway |
| MARSON BOUND BY FOXP3 UNSTIMULATED | 1229 | 713 | All SZGR 2.0 genes in this pathway |
| ACEVEDO LIVER CANCER DN | 540 | 340 | All SZGR 2.0 genes in this pathway |
| ACEVEDO LIVER TUMOR VS NORMAL ADJACENT TISSUE DN | 274 | 165 | All SZGR 2.0 genes in this pathway |
| GRADE COLON CANCER UP | 871 | 505 | All SZGR 2.0 genes in this pathway |
| MILI PSEUDOPODIA CHEMOTAXIS DN | 457 | 302 | All SZGR 2.0 genes in this pathway |
| OHGUCHI LIVER HNF4A TARGETS DN | 149 | 85 | All SZGR 2.0 genes in this pathway |
| PILON KLF1 TARGETS DN | 1972 | 1213 | All SZGR 2.0 genes in this pathway |
| LEE BMP2 TARGETS UP | 745 | 475 | All SZGR 2.0 genes in this pathway |
| WAKABAYASHI ADIPOGENESIS PPARG BOUND 8D | 658 | 397 | All SZGR 2.0 genes in this pathway |
| PEDRIOLI MIR31 TARGETS DN | 418 | 245 | All SZGR 2.0 genes in this pathway |