Gene Page: KCNJ11
Summary ?
| GeneID | 3767 |
| Symbol | KCNJ11 |
| Synonyms | BIR|HHF2|IKATP|KIR6.2|MODY13|PHHI|TNDM3 |
| Description | potassium voltage-gated channel subfamily J member 11 |
| Reference | MIM:600937|HGNC:HGNC:6257|Ensembl:ENSG00000187486|HPRD:09022|Vega:OTTHUMG00000165914 |
| Gene type | protein-coding |
| Map location | 11p15.1 |
| Pascal p-value | 0.001 |
| Fetal beta | -0.923 |
| eGene | Caudate basal ganglia Nucleus accumbens basal ganglia Myers' cis & trans Meta |
Gene in Data Sources
| Gene set name | Method of gene set | Description | Info |
|---|---|---|---|
| CV:GWASdb | Genome-wide Association Studies | GWASdb records for schizophrenia | |
| CV:PGCnp | Genome-wide Association Study | GWAS | |
| PMID:cooccur | High-throughput literature-search | Systematic search in PubMed for genes co-occurring with SCZ keywords. A total of 3027 genes were included. | |
| Literature | High-throughput literature-search | Co-occurance with Schizophrenia keywords: schizophrenia,schizophrenias | Click to show details |
Section I. Genetics and epigenetics annotation
 eQTL annotation
| SNP ID | Chromosome | Position | eGene | Gene Entrez ID | pvalue | qvalue | TSS distance | eQTL type |
|---|---|---|---|---|---|---|---|---|
| rs3935159 | chr11 | 17674229 | KCNJ11 | 3767 | 0.16 | cis | ||
| rs4757560 | chr11 | 17690161 | KCNJ11 | 3767 | 0.05 | cis |
Section II. Transcriptome annotation
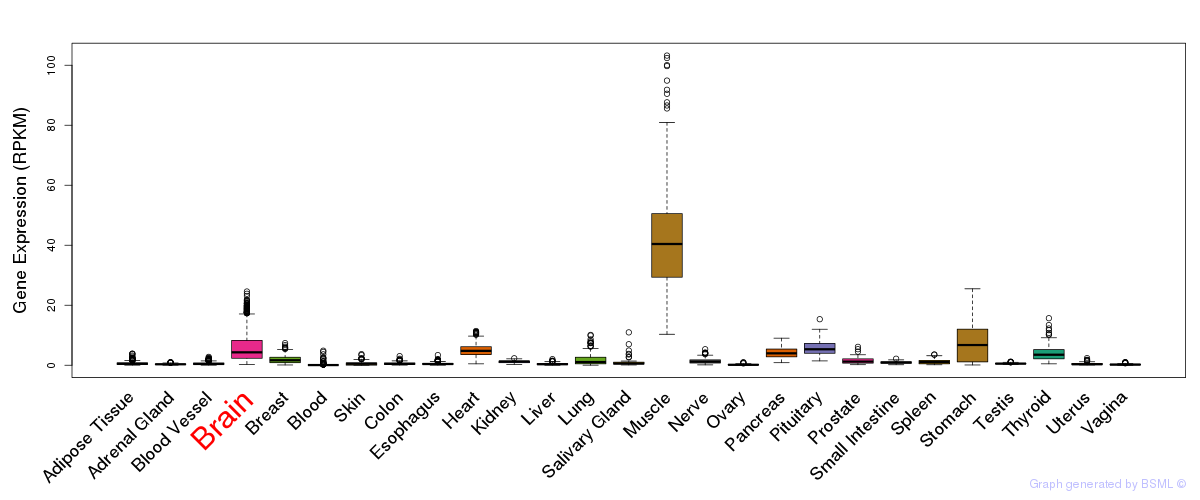
General gene expression (GTEx)
Gene expression during devlopment (BrainCloud)
Footnote:
A total of 269 time points ploted, with n=38 fetal samples (x=1:38). Each triangle represents one time point.
Gene expression of temporal and spatial changes (BrainSpan)
Footnote:
SC: sub-cortical regions; SM: sensory-motor regions; FC: frontal cortex; and TP: temporal-parietal cortex
ST1: fetal (13 - 26 postconception weeks), ST2: early infancy to late childhood (4 months to 11 years), and ST3: adolescence to adulthood (13 - 23 years)
The bar shown representes the lower 25% and upper 25% of the expression distribution.
Top co-expressed genes in brain regions
| Top 10 positively co-expressed genes | ||
| Gene | Pearson's Correlation | Spearman's Correlation |
| DNHD1 | 0.74 | 0.72 |
| MYO15B | 0.72 | 0.71 |
| TBC1D2 | 0.69 | 0.70 |
| MYO15B | 0.68 | 0.65 |
| PDE6B | 0.67 | 0.67 |
| TENC1 | 0.66 | 0.74 |
| CC2D1B | 0.66 | 0.67 |
| TTC7A | 0.65 | 0.65 |
| TJAP1 | 0.64 | 0.70 |
| NRBP2 | 0.64 | 0.64 |
| Top 10 negatively co-expressed genes | ||
| Gene | Pearson's Correlation | Spearman's Correlation |
| BAG1 | -0.38 | -0.43 |
| CAPZA2 | -0.36 | -0.39 |
| C1QBP | -0.34 | -0.35 |
| SUB1 | -0.34 | -0.36 |
| ZCCHC17 | -0.34 | -0.36 |
| PSMA6 | -0.34 | -0.39 |
| GADD45GIP1 | -0.34 | -0.43 |
| BRP44 | -0.34 | -0.37 |
| MRPS28 | -0.33 | -0.47 |
| SNX3 | -0.33 | -0.34 |
Section V. Pathway annotation
| Pathway name | Pathway size | # SZGR 2.0 genes in pathway | Info |
|---|---|---|---|
| KEGG TYPE II DIABETES MELLITUS | 47 | 41 | All SZGR 2.0 genes in this pathway |
| PID HNF3B PATHWAY | 45 | 37 | All SZGR 2.0 genes in this pathway |
| REACTOME NEURONAL SYSTEM | 279 | 221 | All SZGR 2.0 genes in this pathway |
| REACTOME INTEGRATION OF ENERGY METABOLISM | 120 | 84 | All SZGR 2.0 genes in this pathway |
| REACTOME REGULATION OF INSULIN SECRETION | 93 | 65 | All SZGR 2.0 genes in this pathway |
| REACTOME POTASSIUM CHANNELS | 98 | 68 | All SZGR 2.0 genes in this pathway |
| REACTOME INWARDLY RECTIFYING K CHANNELS | 31 | 20 | All SZGR 2.0 genes in this pathway |
| SANSOM APC TARGETS DN | 366 | 238 | All SZGR 2.0 genes in this pathway |
| ZHAN MULTIPLE MYELOMA LB UP | 48 | 28 | All SZGR 2.0 genes in this pathway |
| SAFFORD T LYMPHOCYTE ANERGY | 87 | 54 | All SZGR 2.0 genes in this pathway |
| YOSHIMURA MAPK8 TARGETS UP | 1305 | 895 | All SZGR 2.0 genes in this pathway |
| MIKKELSEN MEF HCP WITH H3 UNMETHYLATED | 228 | 119 | All SZGR 2.0 genes in this pathway |
| PILON KLF1 TARGETS DN | 1972 | 1213 | All SZGR 2.0 genes in this pathway |
| BRUINS UVC RESPONSE VIA TP53 GROUP A | 898 | 516 | All SZGR 2.0 genes in this pathway |