Gene Page: KRT83
Summary ?
| GeneID | 3889 |
| Symbol | KRT83 |
| Synonyms | HB3|Hb-3|KRTHB3 |
| Description | keratin 83 |
| Reference | MIM:602765|HGNC:HGNC:6460|Ensembl:ENSG00000170523|HPRD:09097|Vega:OTTHUMG00000169632 |
| Gene type | protein-coding |
| Map location | 12q13 |
| Pascal p-value | 0.027 |
| Fetal beta | -0.584 |
| eGene | Anterior cingulate cortex BA24 Cortex Frontal Cortex BA9 |
Gene in Data Sources
| Gene set name | Method of gene set | Description | Info |
|---|---|---|---|
| CV:GWASdb | Genome-wide Association Studies | GWASdb records for schizophrenia | |
| CV:PGCnp | Genome-wide Association Study | GWAS |
Section I. Genetics and epigenetics annotation
 eQTL annotation
| SNP ID | Chromosome | Position | eGene | Gene Entrez ID | pvalue | qvalue | TSS distance | eQTL type |
|---|---|---|---|---|---|---|---|---|
| rs182106839 | 12 | 52698045 | KRT83 | ENSG00000170523.3 | 2.183E-6 | 0.02 | 17137 | gtex_brain_ba24 |
| rs2857673 | 12 | 52707973 | KRT83 | ENSG00000170523.3 | 7.525E-7 | 0.02 | 7209 | gtex_brain_ba24 |
| rs11285858 | 12 | 52708090 | KRT83 | ENSG00000170523.3 | 7.524E-7 | 0.02 | 7092 | gtex_brain_ba24 |
| rs2852469 | 12 | 52709429 | KRT83 | ENSG00000170523.3 | 7.522E-7 | 0.02 | 5753 | gtex_brain_ba24 |
| rs2852468 | 12 | 52709880 | KRT83 | ENSG00000170523.3 | 7.512E-7 | 0.02 | 5302 | gtex_brain_ba24 |
| rs2248473 | 12 | 52709883 | KRT83 | ENSG00000170523.3 | 7.512E-7 | 0.02 | 5299 | gtex_brain_ba24 |
| rs11611330 | 12 | 52710037 | KRT83 | ENSG00000170523.3 | 7.522E-7 | 0.02 | 5145 | gtex_brain_ba24 |
| rs56118466 | 12 | 52710102 | KRT83 | ENSG00000170523.3 | 7.522E-7 | 0.02 | 5080 | gtex_brain_ba24 |
| rs55722266 | 12 | 52710198 | KRT83 | ENSG00000170523.3 | 7.522E-7 | 0.02 | 4984 | gtex_brain_ba24 |
| rs2270267 | 12 | 52710246 | KRT83 | ENSG00000170523.3 | 7.522E-7 | 0.02 | 4936 | gtex_brain_ba24 |
| rs2257286 | 12 | 52710309 | KRT83 | ENSG00000170523.3 | 7.522E-7 | 0.02 | 4873 | gtex_brain_ba24 |
| rs2857669 | 12 | 52710715 | KRT83 | ENSG00000170523.3 | 7.522E-7 | 0.02 | 4467 | gtex_brain_ba24 |
| rs2852464 | 12 | 52710721 | KRT83 | ENSG00000170523.3 | 2.334E-6 | 0.02 | 4461 | gtex_brain_ba24 |
| rs2852463 | 12 | 52710897 | KRT83 | ENSG00000170523.3 | 7.513E-7 | 0.02 | 4285 | gtex_brain_ba24 |
| rs2857668 | 12 | 52710898 | KRT83 | ENSG00000170523.3 | 7.522E-7 | 0.02 | 4284 | gtex_brain_ba24 |
| rs2852462 | 12 | 52710913 | KRT83 | ENSG00000170523.3 | 7.522E-7 | 0.02 | 4269 | gtex_brain_ba24 |
| rs2852460 | 12 | 52711416 | KRT83 | ENSG00000170523.3 | 7.522E-7 | 0.02 | 3766 | gtex_brain_ba24 |
| rs2857667 | 12 | 52711549 | KRT83 | ENSG00000170523.3 | 1.529E-6 | 0.02 | 3633 | gtex_brain_ba24 |
| rs2857666 | 12 | 52711624 | KRT83 | ENSG00000170523.3 | 7.61E-7 | 0.02 | 3558 | gtex_brain_ba24 |
| rs2852459 | 12 | 52711776 | KRT83 | ENSG00000170523.3 | 7.687E-7 | 0.02 | 3406 | gtex_brain_ba24 |
| rs2852458 | 12 | 52712249 | KRT83 | ENSG00000170523.3 | 8.306E-7 | 0.02 | 2933 | gtex_brain_ba24 |
Section II. Transcriptome annotation
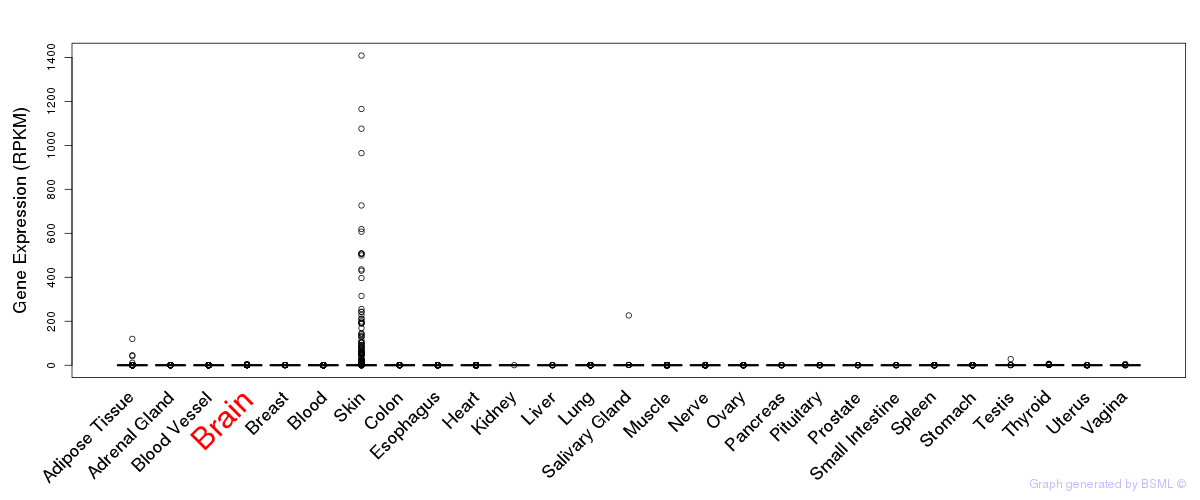
General gene expression (GTEx)
Gene expression during devlopment (BrainCloud)
Footnote:
A total of 269 time points ploted, with n=38 fetal samples (x=1:38). Each triangle represents one time point.
Gene expression of temporal and spatial changes (BrainSpan)
Footnote:
SC: sub-cortical regions; SM: sensory-motor regions; FC: frontal cortex; and TP: temporal-parietal cortex
ST1: fetal (13 - 26 postconception weeks), ST2: early infancy to late childhood (4 months to 11 years), and ST3: adolescence to adulthood (13 - 23 years)
The bar shown representes the lower 25% and upper 25% of the expression distribution.
Top co-expressed genes in brain regions
| Top 10 positively co-expressed genes | ||
| Gene | Pearson's Correlation | Spearman's Correlation |
| FAM43B | 0.74 | 0.78 |
| KIF17 | 0.72 | 0.78 |
| ALK | 0.72 | 0.78 |
| CACNA2D3 | 0.71 | 0.69 |
| MYH7 | 0.71 | 0.73 |
| GLT1D1 | 0.69 | 0.79 |
| BRUNOL4 | 0.69 | 0.72 |
| MARCH11 | 0.69 | 0.73 |
| FUT1 | 0.68 | 0.65 |
| CDH8 | 0.68 | 0.77 |
| Top 10 negatively co-expressed genes | ||
| Gene | Pearson's Correlation | Spearman's Correlation |
| NEUROD6 | -0.32 | -0.06 |
| SLA | -0.32 | -0.00 |
| DAB1 | -0.31 | 0.01 |
| DACT1 | -0.31 | 0.05 |
| AF347015.21 | -0.31 | -0.11 |
| FAT4 | -0.31 | -0.02 |
| TMEM108 | -0.30 | -0.04 |
| NEUROD2 | -0.30 | -0.03 |
| SCUBE1 | -0.30 | -0.17 |
| KLHL1 | -0.30 | 0.03 |
Section V. Pathway annotation
| Pathway name | Pathway size | # SZGR 2.0 genes in pathway | Info |
|---|---|---|---|
| PUJANA ATM PCC NETWORK | 1442 | 892 | All SZGR 2.0 genes in this pathway |
| TARTE PLASMA CELL VS PLASMABLAST UP | 398 | 262 | All SZGR 2.0 genes in this pathway |
| ACEVEDO METHYLATED IN LIVER CANCER DN | 940 | 425 | All SZGR 2.0 genes in this pathway |
| SMID BREAST CANCER RELAPSE IN BONE DN | 315 | 197 | All SZGR 2.0 genes in this pathway |
| SMID BREAST CANCER BASAL UP | 648 | 398 | All SZGR 2.0 genes in this pathway |
| MEISSNER NPC HCP WITH H3 UNMETHYLATED | 536 | 296 | All SZGR 2.0 genes in this pathway |
| MEISSNER BRAIN HCP WITH H3K27ME3 | 269 | 159 | All SZGR 2.0 genes in this pathway |
| MIKKELSEN MEF HCP WITH H3K27ME3 | 590 | 403 | All SZGR 2.0 genes in this pathway |
| MARTENS TRETINOIN RESPONSE UP | 857 | 456 | All SZGR 2.0 genes in this pathway |