Gene Page: LAG3
Summary ?
| GeneID | 3902 |
| Symbol | LAG3 |
| Synonyms | CD223 |
| Description | lymphocyte activating 3 |
| Reference | MIM:153337|HGNC:HGNC:6476|Ensembl:ENSG00000089692|HPRD:01077|Vega:OTTHUMG00000169197 |
| Gene type | protein-coding |
| Map location | 12p13.32 |
| Pascal p-value | 0.037 |
| Fetal beta | -0.004 |
| DMG | 1 (# studies) |
| eGene | Myers' cis & trans |
Gene in Data Sources
| Gene set name | Method of gene set | Description | Info |
|---|---|---|---|
| DMG:vanEijk_2014 | Genome-wide DNA methylation analysis | This dataset includes 432 differentially methylated CpG sites corresponding to 391 unique transcripts between schizophrenia patients (n=260) and unaffected controls (n=250). | 1 |
| PMID:cooccur | High-throughput literature-search | Systematic search in PubMed for genes co-occurring with SCZ keywords. A total of 3027 genes were included. | |
| Literature | High-throughput literature-search | Co-occurance with Schizophrenia keywords: schizophrenia,schizophrenias | Click to show details |
Section I. Genetics and epigenetics annotation
 Differentially methylated gene
| Probe | Chromosome | Position | Nearest gene | P (dis) | Beta (dis) | FDR (dis) | Study |
|---|---|---|---|---|---|---|---|
| cg04956511 | 12 | 7056008 | LAG3 | 1.158E-4 | 7.648 | DMG:vanEijk_2014 |
 eQTL annotation
| SNP ID | Chromosome | Position | eGene | Gene Entrez ID | pvalue | qvalue | TSS distance | eQTL type |
|---|---|---|---|---|---|---|---|---|
| rs16869851 | chr4 | 20690056 | LAG3 | 3902 | 0.06 | trans |
Section II. Transcriptome annotation
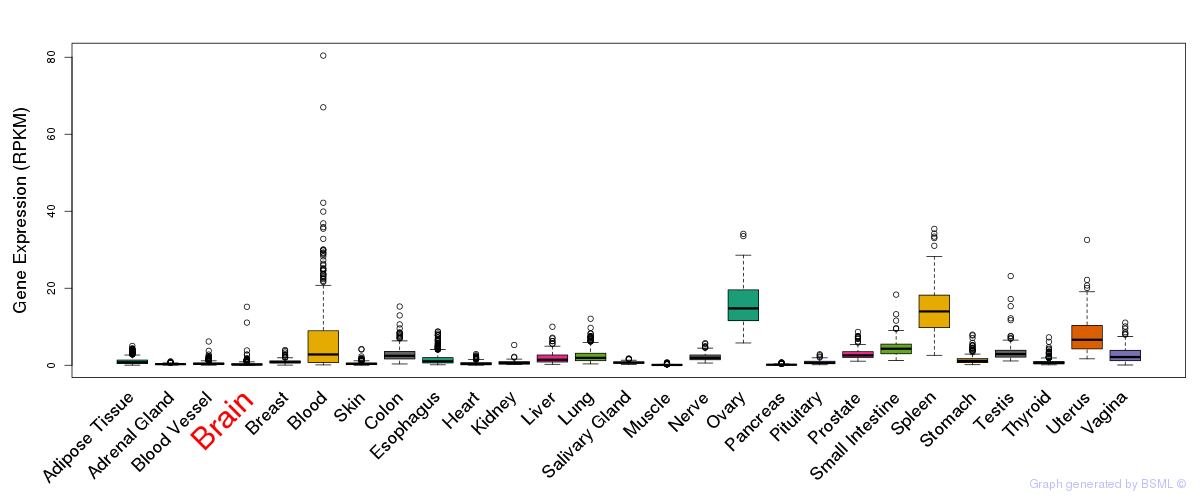
General gene expression (GTEx)

Gene expression during devlopment (BrainCloud)
Footnote:
A total of 269 time points ploted, with n=38 fetal samples (x=1:38). Each triangle represents one time point.
Gene expression of temporal and spatial changes (BrainSpan)
Footnote:
SC: sub-cortical regions; SM: sensory-motor regions; FC: frontal cortex; and TP: temporal-parietal cortex
ST1: fetal (13 - 26 postconception weeks), ST2: early infancy to late childhood (4 months to 11 years), and ST3: adolescence to adulthood (13 - 23 years)
The bar shown representes the lower 25% and upper 25% of the expression distribution.
Top co-expressed genes in brain regions
| Top 10 positively co-expressed genes | ||
| Gene | Pearson's Correlation | Spearman's Correlation |
| RNF40 | 0.95 | 0.95 |
| AMBRA1 | 0.95 | 0.95 |
| CHMP7 | 0.94 | 0.95 |
| LSM14B | 0.94 | 0.95 |
| RAB35 | 0.93 | 0.95 |
| STRN4 | 0.93 | 0.93 |
| CHERP | 0.93 | 0.94 |
| SARM1 | 0.93 | 0.95 |
| PHF13 | 0.92 | 0.94 |
| CPSF6 | 0.92 | 0.95 |
| Top 10 negatively co-expressed genes | ||
| Gene | Pearson's Correlation | Spearman's Correlation |
| FXYD1 | -0.80 | -0.88 |
| AF347015.31 | -0.80 | -0.88 |
| MT-CO2 | -0.80 | -0.89 |
| S100B | -0.79 | -0.86 |
| AF347015.33 | -0.78 | -0.87 |
| C5orf53 | -0.77 | -0.80 |
| AC021016.1 | -0.77 | -0.86 |
| MT-CYB | -0.76 | -0.86 |
| HIGD1B | -0.76 | -0.87 |
| AF347015.27 | -0.75 | -0.86 |
Section V. Pathway annotation
| Pathway name | Pathway size | # SZGR 2.0 genes in pathway | Info |
|---|---|---|---|
| BERTUCCI MEDULLARY VS DUCTAL BREAST CANCER UP | 206 | 111 | All SZGR 2.0 genes in this pathway |
| HUTTMANN B CLL POOR SURVIVAL UP | 276 | 187 | All SZGR 2.0 genes in this pathway |
| DARWICHE PAPILLOMA PROGRESSION RISK | 74 | 44 | All SZGR 2.0 genes in this pathway |
| ZHAN MULTIPLE MYELOMA HP UP | 49 | 26 | All SZGR 2.0 genes in this pathway |
| SAFFORD T LYMPHOCYTE ANERGY | 87 | 54 | All SZGR 2.0 genes in this pathway |
| RIZKI TUMOR INVASIVENESS 3D DN | 270 | 181 | All SZGR 2.0 genes in this pathway |
| QI PLASMACYTOMA UP | 259 | 185 | All SZGR 2.0 genes in this pathway |
| GOLDRATH ANTIGEN RESPONSE | 346 | 192 | All SZGR 2.0 genes in this pathway |
| MIKKELSEN MEF HCP WITH H3 UNMETHYLATED | 228 | 119 | All SZGR 2.0 genes in this pathway |
| LI INDUCED T TO NATURAL KILLER UP | 307 | 182 | All SZGR 2.0 genes in this pathway |
| LIM MAMMARY STEM CELL UP | 489 | 314 | All SZGR 2.0 genes in this pathway |
| ZWANG TRANSIENTLY UP BY 1ST EGF PULSE ONLY | 1839 | 928 | All SZGR 2.0 genes in this pathway |