Gene Page: LYL1
Summary ?
| GeneID | 4066 |
| Symbol | LYL1 |
| Synonyms | bHLHa18 |
| Description | lymphoblastic leukemia associated hematopoiesis regulator 1 |
| Reference | MIM:151440|HGNC:HGNC:6734|Ensembl:ENSG00000104903|HPRD:01046|Vega:OTTHUMG00000180736 |
| Gene type | protein-coding |
| Map location | 19p13.2 |
| Pascal p-value | 1.327E-4 |
| Sherlock p-value | 0.014 |
| Fetal beta | -0.341 |
| eGene | Myers' cis & trans |
Gene in Data Sources
| Gene set name | Method of gene set | Description | Info |
|---|---|---|---|
| CV:PGCnp | Genome-wide Association Study | GWAS |
Section I. Genetics and epigenetics annotation
 eQTL annotation
| SNP ID | Chromosome | Position | eGene | Gene Entrez ID | pvalue | qvalue | TSS distance | eQTL type |
|---|---|---|---|---|---|---|---|---|
| rs4844714 | chr1 | 208874118 | LYL1 | 4066 | 0.02 | trans | ||
| rs17354739 | chr5 | 9921373 | LYL1 | 4066 | 0.12 | trans | ||
| rs10038062 | chr5 | 35220518 | LYL1 | 4066 | 0.09 | trans | ||
| rs7731153 | chr5 | 35220864 | LYL1 | 4066 | 0.09 | trans | ||
| rs9327725 | chr5 | 134887432 | LYL1 | 4066 | 0.13 | trans | ||
| rs17775722 | chr9 | 26199256 | LYL1 | 4066 | 0.16 | trans | ||
| rs3860999 | chr9 | 36848141 | LYL1 | 4066 | 0.2 | trans | ||
| rs17076272 | chr13 | 22726361 | LYL1 | 4066 | 0.02 | trans | ||
| rs17076274 | chr13 | 22726381 | LYL1 | 4066 | 0.02 | trans | ||
| rs7053743 | chrX | 19247669 | LYL1 | 4066 | 0.13 | trans |
Section II. Transcriptome annotation
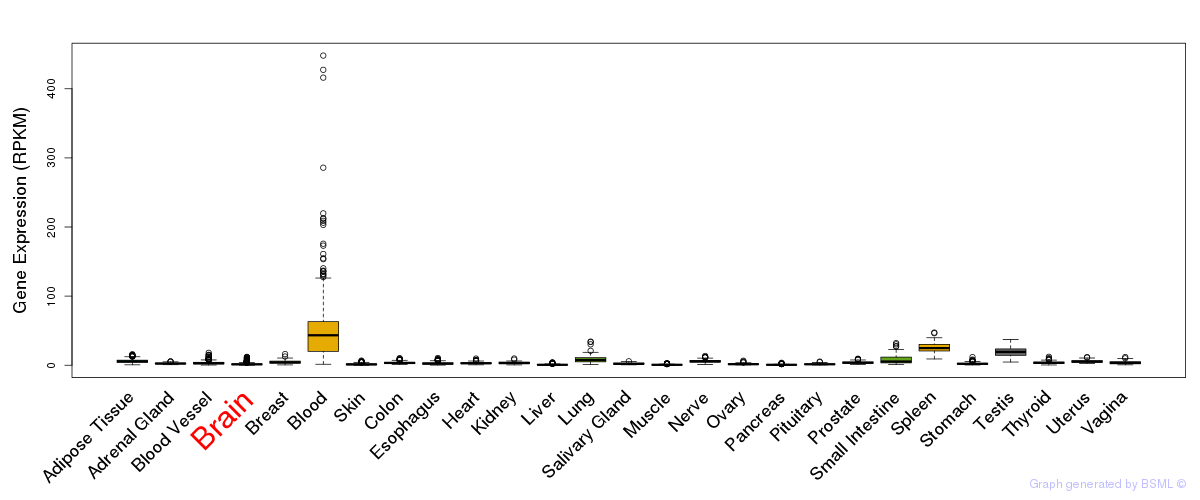
General gene expression (GTEx)
Gene expression during devlopment (BrainCloud)
Footnote:
A total of 269 time points ploted, with n=38 fetal samples (x=1:38). Each triangle represents one time point.
Gene expression of temporal and spatial changes (BrainSpan)
Footnote:
SC: sub-cortical regions; SM: sensory-motor regions; FC: frontal cortex; and TP: temporal-parietal cortex
ST1: fetal (13 - 26 postconception weeks), ST2: early infancy to late childhood (4 months to 11 years), and ST3: adolescence to adulthood (13 - 23 years)
The bar shown representes the lower 25% and upper 25% of the expression distribution.
Top co-expressed genes in brain regions
| Top 10 positively co-expressed genes | ||
| Gene | Pearson's Correlation | Spearman's Correlation |
| ID1 | 0.84 | 0.76 |
| ENG | 0.80 | 0.83 |
| SOX17 | 0.78 | 0.77 |
| GIMAP1 | 0.74 | 0.71 |
| A4GALT | 0.73 | 0.73 |
| SEMA3G | 0.73 | 0.77 |
| SHE | 0.72 | 0.75 |
| GATA2 | 0.72 | 0.74 |
| PTRF | 0.72 | 0.78 |
| TMEM204 | 0.71 | 0.72 |
| Top 10 negatively co-expressed genes | ||
| Gene | Pearson's Correlation | Spearman's Correlation |
| COQ3 | -0.55 | -0.58 |
| FRG1 | -0.54 | -0.64 |
| GNL3 | -0.53 | -0.54 |
| EIF2B3 | -0.53 | -0.54 |
| SETD4 | -0.53 | -0.52 |
| SUPV3L1 | -0.53 | -0.55 |
| FAM92A1 | -0.53 | -0.58 |
| FARSB | -0.53 | -0.54 |
| HYLS1 | -0.52 | -0.54 |
| NDUFAF2 | -0.52 | -0.64 |
Section V. Pathway annotation
| Pathway name | Pathway size | # SZGR 2.0 genes in pathway | Info |
|---|---|---|---|
| GARGALOVIC RESPONSE TO OXIDIZED PHOSPHOLIPIDS TURQUOISE DN | 53 | 25 | All SZGR 2.0 genes in this pathway |
| DODD NASOPHARYNGEAL CARCINOMA UP | 1821 | 933 | All SZGR 2.0 genes in this pathway |
| MARKEY RB1 ACUTE LOF UP | 215 | 137 | All SZGR 2.0 genes in this pathway |
| LANDIS ERBB2 BREAST TUMORS 324 DN | 149 | 93 | All SZGR 2.0 genes in this pathway |
| HATADA METHYLATED IN LUNG CANCER UP | 390 | 236 | All SZGR 2.0 genes in this pathway |
| TARTE PLASMA CELL VS B LYMPHOCYTE DN | 38 | 25 | All SZGR 2.0 genes in this pathway |
| BYSTROEM CORRELATED WITH IL5 UP | 51 | 30 | All SZGR 2.0 genes in this pathway |
| SANSOM APC TARGETS DN | 366 | 238 | All SZGR 2.0 genes in this pathway |
| NEMETH INFLAMMATORY RESPONSE LPS DN | 32 | 25 | All SZGR 2.0 genes in this pathway |
| TAVOR CEBPA TARGETS DN | 30 | 21 | All SZGR 2.0 genes in this pathway |
| PETROVA ENDOTHELIUM LYMPHATIC VS BLOOD DN | 162 | 102 | All SZGR 2.0 genes in this pathway |
| PETROVA PROX1 TARGETS DN | 64 | 38 | All SZGR 2.0 genes in this pathway |
| IGLESIAS E2F TARGETS UP | 151 | 103 | All SZGR 2.0 genes in this pathway |
| GAVIN FOXP3 TARGETS CLUSTER P3 | 160 | 103 | All SZGR 2.0 genes in this pathway |
| SMID BREAST CANCER NORMAL LIKE UP | 476 | 285 | All SZGR 2.0 genes in this pathway |
| GRESHOCK CANCER COPY NUMBER UP | 323 | 240 | All SZGR 2.0 genes in this pathway |
| GOLDRATH ANTIGEN RESPONSE | 346 | 192 | All SZGR 2.0 genes in this pathway |
| SWEET LUNG CANCER KRAS DN | 435 | 289 | All SZGR 2.0 genes in this pathway |
| CHEN METABOLIC SYNDROM NETWORK | 1210 | 725 | All SZGR 2.0 genes in this pathway |
| MEISSNER ES ICP WITH H3K4ME3 AND H3K27ME3 | 14 | 8 | All SZGR 2.0 genes in this pathway |
| MEISSNER NPC ICP WITH H3 UNMETHYLATED | 24 | 15 | All SZGR 2.0 genes in this pathway |
| JISON SICKLE CELL DISEASE UP | 181 | 106 | All SZGR 2.0 genes in this pathway |
| MIKKELSEN IPS ICP WITH H3K4ME3 AND H327ME3 | 126 | 83 | All SZGR 2.0 genes in this pathway |
| MIKKELSEN ES ICP WITH H3K4ME3 AND H3K27ME3 | 137 | 85 | All SZGR 2.0 genes in this pathway |
| MARTENS BOUND BY PML RARA FUSION | 456 | 287 | All SZGR 2.0 genes in this pathway |
| ACOSTA PROLIFERATION INDEPENDENT MYC TARGETS DN | 116 | 74 | All SZGR 2.0 genes in this pathway |
| PLASARI TGFB1 SIGNALING VIA NFIC 10HR DN | 30 | 25 | All SZGR 2.0 genes in this pathway |
| ZWANG TRANSIENTLY UP BY 2ND EGF PULSE ONLY | 1725 | 838 | All SZGR 2.0 genes in this pathway |