Gene Page: MMP17
Summary ?
| GeneID | 4326 |
| Symbol | MMP17 |
| Synonyms | MMP-17|MT4-MMP|MT4MMP|MTMMP4 |
| Description | matrix metallopeptidase 17 |
| Reference | MIM:602285|HGNC:HGNC:7163|Ensembl:ENSG00000198598|HPRD:03793|Vega:OTTHUMG00000168050 |
| Gene type | protein-coding |
| Map location | 12q24.3 |
| Pascal p-value | 0.415 |
| Sherlock p-value | 0.942 |
| Fetal beta | -0.447 |
| DMG | 1 (# studies) |
| eGene | Myers' cis & trans |
Gene in Data Sources
| Gene set name | Method of gene set | Description | Info |
|---|---|---|---|
| CV:PGCnp | Genome-wide Association Study | GWAS | |
| DMG:Wockner_2014 | Genome-wide DNA methylation analysis | This dataset includes 4641 differentially methylated probes corresponding to 2929 unique genes between schizophrenia patients (n=24) and controls (n=24). | 1 |
Section I. Genetics and epigenetics annotation
 Differentially methylated gene
| Probe | Chromosome | Position | Nearest gene | P (dis) | Beta (dis) | FDR (dis) | Study |
|---|---|---|---|---|---|---|---|
| cg10632507 | 12 | 132317390 | MMP17 | 1.951E-4 | 0.434 | 0.035 | DMG:Wockner_2014 |
eQTL annotation
| SNP ID | Chromosome | Position | eGene | Gene Entrez ID | pvalue | qvalue | TSS distance | eQTL type |
|---|---|---|---|---|---|---|---|---|
| rs6588375 | chr1 | 50594945 | MMP17 | 4326 | 0.11 | trans |
Section II. Transcriptome annotation
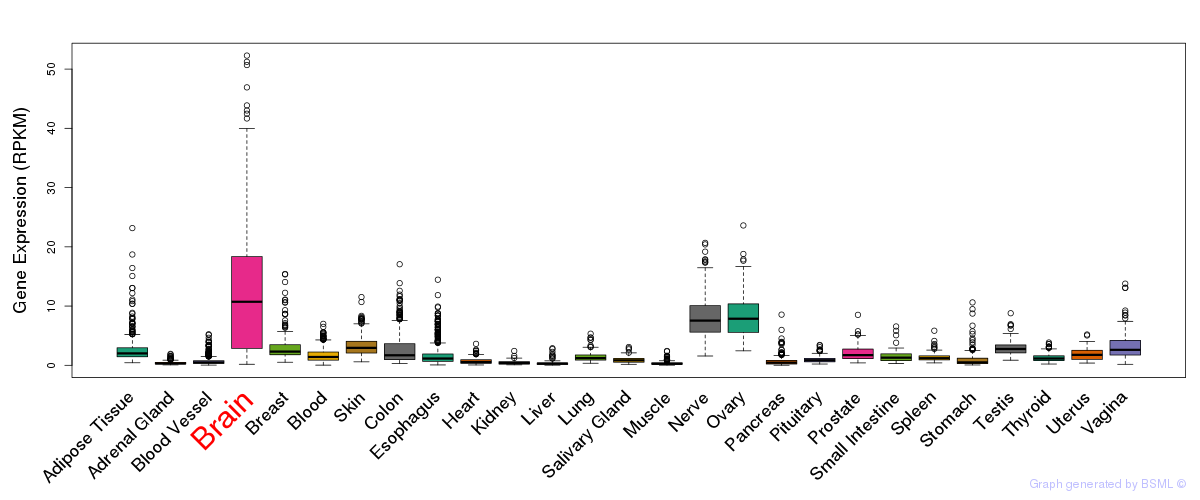
General gene expression (GTEx)
Gene expression during devlopment (BrainCloud)
Footnote:
A total of 269 time points ploted, with n=38 fetal samples (x=1:38). Each triangle represents one time point.
Gene expression of temporal and spatial changes (BrainSpan)
Footnote:
SC: sub-cortical regions; SM: sensory-motor regions; FC: frontal cortex; and TP: temporal-parietal cortex
ST1: fetal (13 - 26 postconception weeks), ST2: early infancy to late childhood (4 months to 11 years), and ST3: adolescence to adulthood (13 - 23 years)
The bar shown representes the lower 25% and upper 25% of the expression distribution.
Top co-expressed genes in brain regions
| Top 10 positively co-expressed genes | ||
| Gene | Pearson's Correlation | Spearman's Correlation |
| LTK | 0.85 | 0.76 |
| KIAA0748 | 0.77 | 0.75 |
| FHL2 | 0.77 | 0.60 |
| AC103681.1 | 0.75 | 0.69 |
| HTR3B | 0.75 | 0.70 |
| SLC22A9 | 0.75 | 0.70 |
| ITPKA | 0.74 | 0.71 |
| GALNTL5 | 0.74 | 0.68 |
| SLC25A45 | 0.74 | 0.73 |
| EXTL1 | 0.74 | 0.72 |
| Top 10 negatively co-expressed genes | ||
| Gene | Pearson's Correlation | Spearman's Correlation |
| PKN1 | -0.44 | -0.49 |
| PDE9A | -0.43 | -0.52 |
| TUBB2B | -0.42 | -0.53 |
| YBX1 | -0.42 | -0.53 |
| FAM36A | -0.42 | -0.48 |
| KIAA1949 | -0.41 | -0.45 |
| IDH1 | -0.41 | -0.48 |
| NKIRAS2 | -0.40 | -0.34 |
| GPR125 | -0.40 | -0.38 |
| ARMCX6 | -0.40 | -0.44 |
Section V. Pathway annotation
| Pathway name | Pathway size | # SZGR 2.0 genes in pathway | Info |
|---|---|---|---|
| REACTOME DEGRADATION OF THE EXTRACELLULAR MATRIX | 29 | 11 | All SZGR 2.0 genes in this pathway |
| REACTOME EXTRACELLULAR MATRIX ORGANIZATION | 87 | 42 | All SZGR 2.0 genes in this pathway |
| SCIAN INVERSED TARGETS OF TP53 AND TP73 UP | 11 | 9 | All SZGR 2.0 genes in this pathway |
| NIKOLSKY BREAST CANCER 12Q24 AMPLICON | 15 | 7 | All SZGR 2.0 genes in this pathway |
| BYSTRYKH HEMATOPOIESIS STEM CELL AND BRAIN QTL TRANS | 185 | 114 | All SZGR 2.0 genes in this pathway |
| BYSTRYKH HEMATOPOIESIS STEM CELL QTL TRANS | 882 | 572 | All SZGR 2.0 genes in this pathway |
| VERRECCHIA DELAYED RESPONSE TO TGFB1 | 39 | 26 | All SZGR 2.0 genes in this pathway |
| VERRECCHIA RESPONSE TO TGFB1 C4 | 13 | 10 | All SZGR 2.0 genes in this pathway |
| RIZKI TUMOR INVASIVENESS 3D UP | 210 | 124 | All SZGR 2.0 genes in this pathway |
| SMID BREAST CANCER BASAL DN | 701 | 446 | All SZGR 2.0 genes in this pathway |
| YAGI AML WITH 11Q23 REARRANGED | 351 | 238 | All SZGR 2.0 genes in this pathway |
| WONG ADULT TISSUE STEM MODULE | 721 | 492 | All SZGR 2.0 genes in this pathway |
| MURAKAMI UV RESPONSE 1HR UP | 17 | 10 | All SZGR 2.0 genes in this pathway |
| PURBEY TARGETS OF CTBP1 NOT SATB1 DN | 448 | 282 | All SZGR 2.0 genes in this pathway |
| ALFANO MYC TARGETS | 239 | 156 | All SZGR 2.0 genes in this pathway |
| NABA ECM REGULATORS | 238 | 125 | All SZGR 2.0 genes in this pathway |
| NABA MATRISOME ASSOCIATED | 753 | 411 | All SZGR 2.0 genes in this pathway |
| NABA MATRISOME | 1028 | 559 | All SZGR 2.0 genes in this pathway |