Gene Page: MYO1E
Summary ?
| GeneID | 4643 |
| Symbol | MYO1E |
| Synonyms | FSGS6|HuncM-IC|MYO1C |
| Description | myosin IE |
| Reference | MIM:601479|HGNC:HGNC:7599|HPRD:03281| |
| Gene type | protein-coding |
| Map location | 15q22.2 |
| Pascal p-value | 0.028 |
| Fetal beta | -0.459 |
| DMG | 2 (# studies) |
| eGene | Frontal Cortex BA9 |
Gene in Data Sources
| Gene set name | Method of gene set | Description | Info |
|---|---|---|---|
| CV:GWAScat | Genome-wide Association Studies | This data set includes 560 SNPs associated with schizophrenia. A total of 486 genes were mapped to these SNPs within 50kb. | |
| CV:GWASdb | Genome-wide Association Studies | GWASdb records for schizophrenia | |
| CV:PGCnp | Genome-wide Association Study | GWAS | |
| DMG:Jaffe_2016 | Genome-wide DNA methylation analysis | This dataset includes 2,104 probes/CpGs associated with SZ patients (n=108) compared to 136 controls at Bonferroni-adjusted P < 0.05. | 2 |
| DMG:Nishioka_2013 | Genome-wide DNA methylation analysis | The authors investigated the methylation profiles of DNA in peripheral blood cells from 18 patients with first-episode schizophrenia (FESZ) and from 15 normal controls. | 2 |
Section I. Genetics and epigenetics annotation
 Differentially methylated gene
| Probe | Chromosome | Position | Nearest gene | P (dis) | Beta (dis) | FDR (dis) | Study |
|---|---|---|---|---|---|---|---|
| cg07684353 | 15 | 59664799 | MYO1E | -0.024 | 0.85 | DMG:Nishioka_2013 | |
| cg07684353 | 15 | 59664799 | MYO1E | 1.33E-9 | -0.021 | 1.35E-6 | DMG:Jaffe_2016 |
Section II. Transcriptome annotation
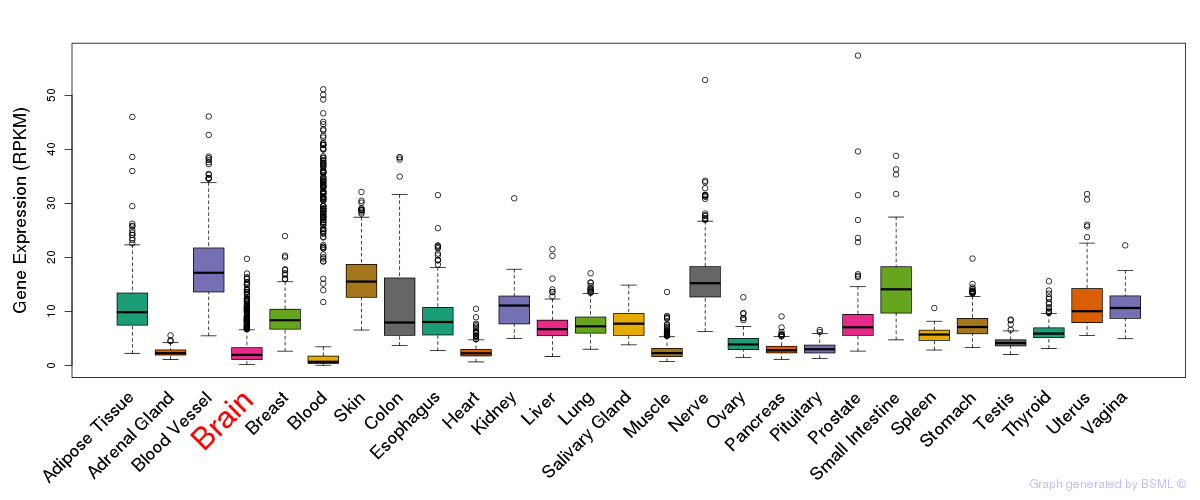
General gene expression (GTEx)
Gene expression during devlopment (BrainCloud)
Footnote:
A total of 269 time points ploted, with n=38 fetal samples (x=1:38). Each triangle represents one time point.
Gene expression of temporal and spatial changes (BrainSpan)
Footnote:
SC: sub-cortical regions; SM: sensory-motor regions; FC: frontal cortex; and TP: temporal-parietal cortex
ST1: fetal (13 - 26 postconception weeks), ST2: early infancy to late childhood (4 months to 11 years), and ST3: adolescence to adulthood (13 - 23 years)
The bar shown representes the lower 25% and upper 25% of the expression distribution.
Top co-expressed genes in brain regions
| Top 10 positively co-expressed genes | ||
| Gene | Pearson's Correlation | Spearman's Correlation |
| ZFP41 | 0.79 | 0.81 |
| TESK1 | 0.78 | 0.75 |
| SHARPIN | 0.78 | 0.84 |
| CRAT | 0.78 | 0.78 |
| PPDPF | 0.77 | 0.78 |
| C22orf36 | 0.77 | 0.81 |
| FHL3 | 0.77 | 0.72 |
| ITFG3 | 0.77 | 0.78 |
| CLN3 | 0.76 | 0.79 |
| GPR172A | 0.76 | 0.74 |
| Top 10 negatively co-expressed genes | ||
| Gene | Pearson's Correlation | Spearman's Correlation |
| AF347015.27 | -0.50 | -0.48 |
| AF347015.8 | -0.48 | -0.49 |
| AF347015.21 | -0.48 | -0.52 |
| MT-CO2 | -0.47 | -0.48 |
| AF347015.31 | -0.47 | -0.46 |
| MT-CYB | -0.47 | -0.47 |
| MT-ATP8 | -0.45 | -0.54 |
| AF347015.33 | -0.45 | -0.45 |
| SEC62 | -0.45 | -0.50 |
| AF347015.15 | -0.44 | -0.45 |
Section V. Pathway annotation
| Pathway name | Pathway size | # SZGR 2.0 genes in pathway | Info |
|---|---|---|---|
| HOLLMANN APOPTOSIS VIA CD40 UP | 201 | 125 | All SZGR 2.0 genes in this pathway |
| DAVICIONI MOLECULAR ARMS VS ERMS UP | 332 | 228 | All SZGR 2.0 genes in this pathway |
| FULCHER INFLAMMATORY RESPONSE LECTIN VS LPS UP | 579 | 346 | All SZGR 2.0 genes in this pathway |
| CHARAFE BREAST CANCER LUMINAL VS BASAL DN | 455 | 304 | All SZGR 2.0 genes in this pathway |
| KIM WT1 TARGETS UP | 214 | 155 | All SZGR 2.0 genes in this pathway |
| GRAESSMANN APOPTOSIS BY DOXORUBICIN DN | 1781 | 1082 | All SZGR 2.0 genes in this pathway |
| APPIERTO RESPONSE TO FENRETINIDE UP | 38 | 26 | All SZGR 2.0 genes in this pathway |
| EBAUER TARGETS OF PAX3 FOXO1 FUSION DN | 48 | 31 | All SZGR 2.0 genes in this pathway |
| KIM MYCN AMPLIFICATION TARGETS UP | 92 | 64 | All SZGR 2.0 genes in this pathway |
| NUYTTEN EZH2 TARGETS UP | 1037 | 673 | All SZGR 2.0 genes in this pathway |
| RICKMAN METASTASIS DN | 261 | 155 | All SZGR 2.0 genes in this pathway |
| PETRETTO BLOOD PRESSURE UP | 12 | 8 | All SZGR 2.0 genes in this pathway |
| ONDER CDH1 TARGETS 2 DN | 464 | 276 | All SZGR 2.0 genes in this pathway |
| ASTON MAJOR DEPRESSIVE DISORDER DN | 160 | 110 | All SZGR 2.0 genes in this pathway |
| MATSUDA NATURAL KILLER DIFFERENTIATION | 475 | 313 | All SZGR 2.0 genes in this pathway |
| NGUYEN NOTCH1 TARGETS DN | 86 | 67 | All SZGR 2.0 genes in this pathway |
| CUI TCF21 TARGETS 2 DN | 830 | 547 | All SZGR 2.0 genes in this pathway |
| BLALOCK ALZHEIMERS DISEASE UP | 1691 | 1088 | All SZGR 2.0 genes in this pathway |
| CHEN PDGF TARGETS | 19 | 9 | All SZGR 2.0 genes in this pathway |
| BAELDE DIABETIC NEPHROPATHY DN | 434 | 302 | All SZGR 2.0 genes in this pathway |
| SAFFORD T LYMPHOCYTE ANERGY | 87 | 54 | All SZGR 2.0 genes in this pathway |
| GAVIN FOXP3 TARGETS CLUSTER P3 | 160 | 103 | All SZGR 2.0 genes in this pathway |
| GAVIN FOXP3 TARGETS CLUSTER P7 | 90 | 52 | All SZGR 2.0 genes in this pathway |
| MARSON BOUND BY FOXP3 UNSTIMULATED | 1229 | 713 | All SZGR 2.0 genes in this pathway |
| CHEN METABOLIC SYNDROM NETWORK | 1210 | 725 | All SZGR 2.0 genes in this pathway |
| CHIANG LIVER CANCER SUBCLASS CTNNB1 DN | 170 | 105 | All SZGR 2.0 genes in this pathway |
| HOSHIDA LIVER CANCER SUBCLASS S3 | 266 | 180 | All SZGR 2.0 genes in this pathway |
| LI INDUCED T TO NATURAL KILLER UP | 307 | 182 | All SZGR 2.0 genes in this pathway |
| DUTERTRE ESTRADIOL RESPONSE 24HR DN | 505 | 328 | All SZGR 2.0 genes in this pathway |
| BRUINS UVC RESPONSE VIA TP53 GROUP A | 898 | 516 | All SZGR 2.0 genes in this pathway |
| PEDERSEN METASTASIS BY ERBB2 ISOFORM 7 | 403 | 240 | All SZGR 2.0 genes in this pathway |
| ZWANG CLASS 1 TRANSIENTLY INDUCED BY EGF | 516 | 308 | All SZGR 2.0 genes in this pathway |