Gene Page: MYO7B
Summary ?
| GeneID | 4648 |
| Symbol | MYO7B |
| Synonyms | - |
| Description | myosin VIIB |
| Reference | MIM:606541|HGNC:HGNC:7607|Ensembl:ENSG00000169994|Vega:OTTHUMG00000153419 |
| Gene type | protein-coding |
| Map location | 2q21.1 |
| Pascal p-value | 0.431 |
| Fetal beta | -0.371 |
| DMG | 1 (# studies) |
Gene in Data Sources
| Gene set name | Method of gene set | Description | Info |
|---|---|---|---|
| CV:PGCnp | Genome-wide Association Study | GWAS | |
| DMG:Wockner_2014 | Genome-wide DNA methylation analysis | This dataset includes 4641 differentially methylated probes corresponding to 2929 unique genes between schizophrenia patients (n=24) and controls (n=24). | 1 |
| PMID:cooccur | High-throughput literature-search | Systematic search in PubMed for genes co-occurring with SCZ keywords. A total of 3027 genes were included. | |
| GSMA_I | Genome scan meta-analysis | Psr: 0.023 | |
| GSMA_IIA | Genome scan meta-analysis (All samples) | Psr: 0.00755 | |
| Literature | High-throughput literature-search | Co-occurance with Schizophrenia keywords: schizophrenia,schizophrenias | Click to show details |
Section I. Genetics and epigenetics annotation
 Differentially methylated gene
| Probe | Chromosome | Position | Nearest gene | P (dis) | Beta (dis) | FDR (dis) | Study |
|---|---|---|---|---|---|---|---|
| cg00778928 | 2 | 128380062 | MYO7B | 5.072E-4 | -0.301 | 0.047 | DMG:Wockner_2014 |
Section II. Transcriptome annotation
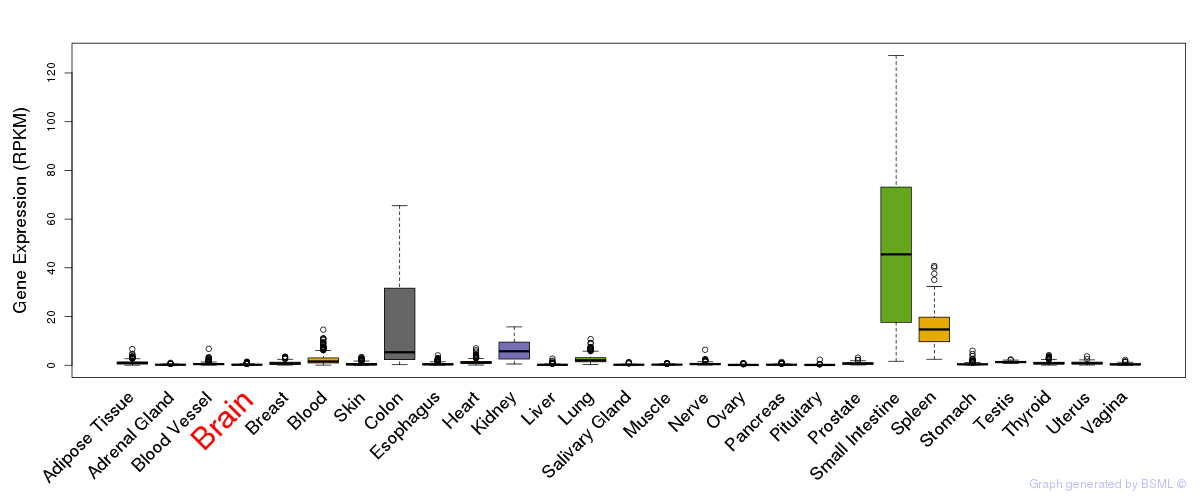
General gene expression (GTEx)
Gene expression during devlopment (BrainCloud)
Footnote:
A total of 269 time points ploted, with n=38 fetal samples (x=1:38). Each triangle represents one time point.
Gene expression of temporal and spatial changes (BrainSpan)
Footnote:
SC: sub-cortical regions; SM: sensory-motor regions; FC: frontal cortex; and TP: temporal-parietal cortex
ST1: fetal (13 - 26 postconception weeks), ST2: early infancy to late childhood (4 months to 11 years), and ST3: adolescence to adulthood (13 - 23 years)
The bar shown representes the lower 25% and upper 25% of the expression distribution.
Top co-expressed genes in brain regions
| Top 10 positively co-expressed genes | ||
| Gene | Pearson's Correlation | Spearman's Correlation |
| MOAP1 | 0.91 | 0.93 |
| IDH3A | 0.91 | 0.93 |
| NSF | 0.91 | 0.92 |
| ATP1B1 | 0.90 | 0.94 |
| SNX10 | 0.90 | 0.94 |
| OXR1 | 0.90 | 0.93 |
| MAPK9 | 0.90 | 0.92 |
| ATP6V1B2 | 0.90 | 0.90 |
| GABRG2 | 0.89 | 0.91 |
| ATP6V1C1 | 0.89 | 0.93 |
| Top 10 negatively co-expressed genes | ||
| Gene | Pearson's Correlation | Spearman's Correlation |
| BCL7C | -0.54 | -0.59 |
| NME4 | -0.53 | -0.62 |
| HYAL2 | -0.50 | -0.50 |
| IRF7 | -0.50 | -0.61 |
| SIGIRR | -0.48 | -0.57 |
| SH3BP2 | -0.47 | -0.46 |
| AC006276.2 | -0.47 | -0.43 |
| MUTYH | -0.46 | -0.45 |
| SEMA4B | -0.46 | -0.38 |
| SMTN | -0.46 | -0.46 |
Section III. Gene Ontology annotation
| Molecular function | GO term | Evidence | Neuro keywords | PubMed ID |
|---|---|---|---|---|
| GO:0000166 | nucleotide binding | IEA | - | |
| GO:0003779 | actin binding | IEA | - | |
| GO:0003774 | motor activity | IEA | - | |
| GO:0005488 | binding | IEA | - | |
| GO:0005524 | ATP binding | IEA | - | |
| Cellular component | GO term | Evidence | Neuro keywords | PubMed ID |
| GO:0005856 | cytoskeleton | IEA | - | |
| GO:0005886 | plasma membrane | IEA | - | |
| GO:0016324 | apical plasma membrane | IEA | - | |
| GO:0016459 | myosin complex | IEA | - |
Section V. Pathway annotation
| Pathway name | Pathway size | # SZGR 2.0 genes in pathway | Info |
|---|---|---|---|
| SHETH LIVER CANCER VS TXNIP LOSS PAM2 | 153 | 102 | All SZGR 2.0 genes in this pathway |
| ZWANG TRANSIENTLY UP BY 2ND EGF PULSE ONLY | 1725 | 838 | All SZGR 2.0 genes in this pathway |