Gene Page: NEB
Summary ?
| GeneID | 4703 |
| Symbol | NEB |
| Synonyms | NEB177D|NEM2 |
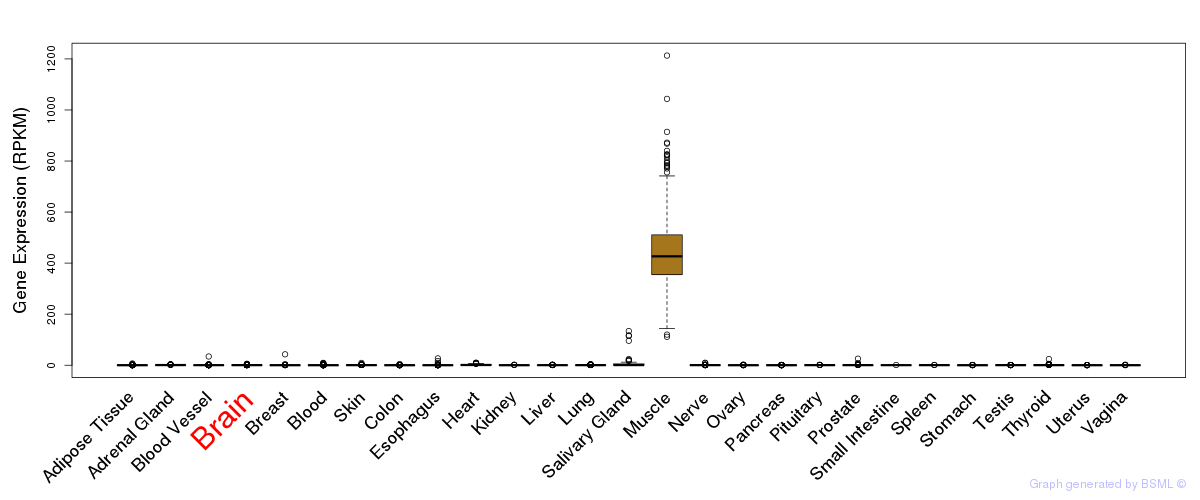
| Description | nebulin |
| Reference | MIM:161650|HGNC:HGNC:7720|Ensembl:ENSG00000183091|HPRD:01196|Vega:OTTHUMG00000153784 |
| Gene type | protein-coding |
| Map location | 2q22 |
| Pascal p-value | 0.036 |
| TADA p-value | 0.008 |
| Fetal beta | -0.642 |
| eGene | Myers' cis & trans |
| Support | CompositeSet |
Gene in Data Sources
| Gene set name | Method of gene set | Description | Info |
|---|---|---|---|
| CV:PGCnp | Genome-wide Association Study | GWAS | |
| DNM:Fromer_2014 | Whole Exome Sequencing analysis | This study reported a WES study of 623 schizophrenia trios, reporting DNMs using genomic DNA. | |
| DNM:Gulsuner_2013 | Whole Exome Sequencing analysis | 155 DNMs identified by exome sequencing of quads or trios of schizophrenia individuals and their parents. | |
| PMID:cooccur | High-throughput literature-search | Systematic search in PubMed for genes co-occurring with SCZ keywords. A total of 3027 genes were included. | |
| GSMA_IIA | Genome scan meta-analysis (All samples) | Psr: 0.02395 | |
| Literature | High-throughput literature-search | Co-occurance with Schizophrenia keywords: schizophrenia,schizophrenic,schizophrenias | Click to show details |
Section I. Genetics and epigenetics annotation
 DNM table
| Gene | Chromosome | Position | Ref | Alt | Transcript | AA change | Mutation type | Sift | CG46 | Trait | Study |
|---|---|---|---|---|---|---|---|---|---|---|---|
| NEB | chr2 | 152548856 | A | T | NM_001164507 NM_001164508 NM_001271208 NM_004543 | p.639Y>* p.639Y>* p.639Y>* p.639Y>* | nonsense nonsense nonsense nonsense | Schizophrenia | DNM:Fromer_2014 | ||
| NEB | chr2 | 152362011 | G | A | NM_001164507 NM_001164508 NM_001271208 NM_004543 | p.7908T>M p.7908T>M p.7943T>M p.6195T>M | missense missense missense missense | Schizophrenia | DNM:Gulsuner_2013 |
eQTL annotation
| SNP ID | Chromosome | Position | eGene | Gene Entrez ID | pvalue | qvalue | TSS distance | eQTL type |
|---|---|---|---|---|---|---|---|---|
| rs4854166 | chr2 | 3297005 | NEB | 4703 | 0.16 | trans |
Section II. Transcriptome annotation
General gene expression (GTEx)
Gene expression during devlopment (BrainCloud)
Footnote:
A total of 269 time points ploted, with n=38 fetal samples (x=1:38). Each triangle represents one time point.
Gene expression of temporal and spatial changes (BrainSpan)
Footnote:
SC: sub-cortical regions; SM: sensory-motor regions; FC: frontal cortex; and TP: temporal-parietal cortex
ST1: fetal (13 - 26 postconception weeks), ST2: early infancy to late childhood (4 months to 11 years), and ST3: adolescence to adulthood (13 - 23 years)
The bar shown representes the lower 25% and upper 25% of the expression distribution.
Top co-expressed genes in brain regions
| Top 10 positively co-expressed genes | ||
| Gene | Pearson's Correlation | Spearman's Correlation |
| TMEM126A | 0.89 | 0.85 |
| MRPS15 | 0.88 | 0.87 |
| MGST3 | 0.87 | 0.80 |
| DNAJC19 | 0.87 | 0.85 |
| UBL5 | 0.86 | 0.78 |
| NDUFS3 | 0.86 | 0.81 |
| COX7B | 0.86 | 0.83 |
| NDUFB6 | 0.86 | 0.79 |
| CMC1 | 0.86 | 0.83 |
| C14orf2 | 0.85 | 0.83 |
| Top 10 negatively co-expressed genes | ||
| Gene | Pearson's Correlation | Spearman's Correlation |
| LRP1 | -0.52 | -0.50 |
| MTSS1L | -0.48 | -0.49 |
| MAP4K4 | -0.48 | -0.50 |
| PXN | -0.48 | -0.58 |
| PHLDB1 | -0.47 | -0.48 |
| SMTN | -0.47 | -0.58 |
| SLC19A1 | -0.47 | -0.48 |
| STK10 | -0.47 | -0.52 |
| TNKS1BP1 | -0.46 | -0.43 |
| AC005035.1 | -0.46 | -0.47 |
Section III. Gene Ontology annotation
| Molecular function | GO term | Evidence | Neuro keywords | PubMed ID |
|---|---|---|---|---|
| GO:0003779 | actin binding | IEA | - | |
| GO:0005515 | protein binding | IPI | 15967462 | |
| GO:0008307 | structural constituent of muscle | TAS | 7739042 | |
| Biological process | GO term | Evidence | Neuro keywords | PubMed ID |
| GO:0007525 | somatic muscle development | NAS | 7739042 | |
| GO:0030832 | regulation of actin filament length | NAS | 7739042 | |
| Cellular component | GO term | Evidence | Neuro keywords | PubMed ID |
| GO:0005737 | cytoplasm | IEA | - | |
| GO:0030018 | Z disc | IDA | 9501083 | |
| GO:0015629 | actin cytoskeleton | TAS | 7739042 |
Section V. Pathway annotation
| Pathway name | Pathway size | # SZGR 2.0 genes in pathway | Info |
|---|---|---|---|
| REACTOME STRIATED MUSCLE CONTRACTION | 27 | 12 | All SZGR 2.0 genes in this pathway |
| REACTOME MUSCLE CONTRACTION | 48 | 24 | All SZGR 2.0 genes in this pathway |
| DAVICIONI TARGETS OF PAX FOXO1 FUSIONS DN | 68 | 49 | All SZGR 2.0 genes in this pathway |
| ZHOU INFLAMMATORY RESPONSE FIMA UP | 544 | 308 | All SZGR 2.0 genes in this pathway |
| RODRIGUES THYROID CARCINOMA ANAPLASTIC DN | 537 | 339 | All SZGR 2.0 genes in this pathway |
| DELYS THYROID CANCER DN | 232 | 154 | All SZGR 2.0 genes in this pathway |
| RICKMAN HEAD AND NECK CANCER F | 54 | 32 | All SZGR 2.0 genes in this pathway |
| ZHAN MULTIPLE MYELOMA UP | 64 | 46 | All SZGR 2.0 genes in this pathway |
| KAAB HEART ATRIUM VS VENTRICLE UP | 249 | 170 | All SZGR 2.0 genes in this pathway |
| GHO ATF5 TARGETS UP | 13 | 10 | All SZGR 2.0 genes in this pathway |
| GAVIN FOXP3 TARGETS CLUSTER P4 | 100 | 62 | All SZGR 2.0 genes in this pathway |
| SANSOM APC TARGETS | 212 | 121 | All SZGR 2.0 genes in this pathway |
| ACEVEDO LIVER CANCER WITH H3K9ME3 UP | 141 | 75 | All SZGR 2.0 genes in this pathway |
| YAUCH HEDGEHOG SIGNALING PARACRINE DN | 264 | 159 | All SZGR 2.0 genes in this pathway |
| PYEON CANCER HEAD AND NECK VS CERVICAL DN | 29 | 11 | All SZGR 2.0 genes in this pathway |
| BRUINS UVC RESPONSE VIA TP53 GROUP A | 898 | 516 | All SZGR 2.0 genes in this pathway |
| BRUINS UVC RESPONSE VIA TP53 GROUP B | 549 | 316 | All SZGR 2.0 genes in this pathway |
| BRUINS UVC RESPONSE LATE | 1137 | 655 | All SZGR 2.0 genes in this pathway |
| BRUINS UVC RESPONSE EARLY LATE | 317 | 190 | All SZGR 2.0 genes in this pathway |
| PURBEY TARGETS OF CTBP1 NOT SATB1 DN | 448 | 282 | All SZGR 2.0 genes in this pathway |
| ZWANG TRANSIENTLY UP BY 2ND EGF PULSE ONLY | 1725 | 838 | All SZGR 2.0 genes in this pathway |