Gene Page: NEK3
Summary ?
| GeneID | 4752 |
| Symbol | NEK3 |
| Synonyms | HSPK36 |
| Description | NIMA related kinase 3 |
| Reference | MIM:604044|HGNC:HGNC:7746|Ensembl:ENSG00000136098|HPRD:04954|Vega:OTTHUMG00000016958 |
| Gene type | protein-coding |
| Map location | 13q14.13 |
| Pascal p-value | 0.361 |
| Sherlock p-value | 8.849E-6 |
| Fetal beta | 0.851 |
Gene in Data Sources
| Gene set name | Method of gene set | Description | Info |
|---|---|---|---|
| CV:PGCnp | Genome-wide Association Study | GWAS |
Section I. Genetics and epigenetics annotation
Section II. Transcriptome annotation
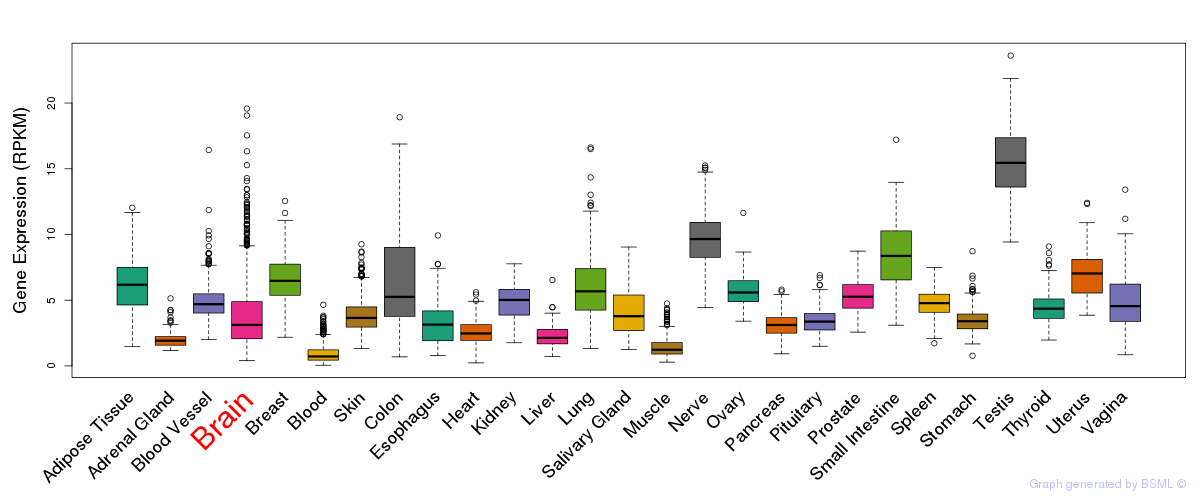
General gene expression (GTEx)

Gene expression during devlopment (BrainCloud)
Footnote:
A total of 269 time points ploted, with n=38 fetal samples (x=1:38). Each triangle represents one time point.
Gene expression of temporal and spatial changes (BrainSpan)
Footnote:
SC: sub-cortical regions; SM: sensory-motor regions; FC: frontal cortex; and TP: temporal-parietal cortex
ST1: fetal (13 - 26 postconception weeks), ST2: early infancy to late childhood (4 months to 11 years), and ST3: adolescence to adulthood (13 - 23 years)
The bar shown representes the lower 25% and upper 25% of the expression distribution.
Top co-expressed genes in brain regions
| Top 10 positively co-expressed genes | ||
| Gene | Pearson's Correlation | Spearman's Correlation |
| EPB42 | 0.83 | 0.60 |
| HEMGN | 0.82 | 0.55 |
| HBM | 0.81 | 0.58 |
| SLC4A1 | 0.81 | 0.61 |
| ALAS2 | 0.80 | 0.63 |
| ERAF | 0.78 | 0.64 |
| HBG1 | 0.74 | 0.54 |
| SPTA1 | 0.74 | 0.50 |
| GATA1 | 0.71 | 0.49 |
| PPBP | 0.71 | 0.61 |
| Top 10 negatively co-expressed genes | ||
| Gene | Pearson's Correlation | Spearman's Correlation |
| CCNI2 | -0.41 | -0.55 |
| CA4 | -0.39 | -0.47 |
| BCL2L2 | -0.39 | -0.48 |
| C5orf53 | -0.39 | -0.47 |
| TUBA1 | -0.38 | -0.53 |
| ITPKA | -0.38 | -0.54 |
| GRASP | -0.38 | -0.50 |
| RAPGEF4 | -0.37 | -0.50 |
| FBXO2 | -0.37 | -0.42 |
| CHN1 | -0.37 | -0.49 |
Section V. Pathway annotation
| Pathway name | Pathway size | # SZGR 2.0 genes in pathway | Info |
|---|---|---|---|
| HOLLMANN APOPTOSIS VIA CD40 DN | 267 | 178 | All SZGR 2.0 genes in this pathway |
| ONKEN UVEAL MELANOMA UP | 783 | 507 | All SZGR 2.0 genes in this pathway |
| LAIHO COLORECTAL CANCER SERRATED DN | 86 | 47 | All SZGR 2.0 genes in this pathway |
| GRAESSMANN APOPTOSIS BY DOXORUBICIN DN | 1781 | 1082 | All SZGR 2.0 genes in this pathway |
| CEBALLOS TARGETS OF TP53 AND MYC UP | 21 | 16 | All SZGR 2.0 genes in this pathway |
| KIM MYC AMPLIFICATION TARGETS UP | 201 | 127 | All SZGR 2.0 genes in this pathway |
| ROPERO HDAC2 TARGETS | 114 | 71 | All SZGR 2.0 genes in this pathway |
| SCHWAB TARGETS OF BMYB POLYMORPHIC VARIANTS DN | 17 | 12 | All SZGR 2.0 genes in this pathway |
| DING LUNG CANCER EXPRESSION BY COPY NUMBER | 100 | 62 | All SZGR 2.0 genes in this pathway |
| SMITH TERT TARGETS UP | 145 | 91 | All SZGR 2.0 genes in this pathway |
| IVANOVA HEMATOPOIESIS LATE PROGENITOR | 544 | 307 | All SZGR 2.0 genes in this pathway |
| KONDO EZH2 TARGETS | 245 | 148 | All SZGR 2.0 genes in this pathway |
| RUTELLA RESPONSE TO CSF2RB AND IL4 UP | 338 | 225 | All SZGR 2.0 genes in this pathway |
| RUTELLA RESPONSE TO HGF DN | 235 | 144 | All SZGR 2.0 genes in this pathway |
| RUTELLA RESPONSE TO HGF VS CSF2RB AND IL4 DN | 245 | 150 | All SZGR 2.0 genes in this pathway |
| BOYAULT LIVER CANCER SUBCLASS G6 UP | 65 | 43 | All SZGR 2.0 genes in this pathway |
| CHIANG LIVER CANCER SUBCLASS CTNNB1 UP | 176 | 110 | All SZGR 2.0 genes in this pathway |
| CHIANG LIVER CANCER SUBCLASS INTERFERON DN | 52 | 30 | All SZGR 2.0 genes in this pathway |
| GUTIERREZ CHRONIC LYMPHOCYTIC LEUKEMIA DN | 56 | 39 | All SZGR 2.0 genes in this pathway |
| KYNG RESPONSE TO H2O2 VIA ERCC6 DN | 46 | 31 | All SZGR 2.0 genes in this pathway |
| FEVR CTNNB1 TARGETS UP | 682 | 433 | All SZGR 2.0 genes in this pathway |
| ZWANG TRANSIENTLY UP BY 2ND EGF PULSE ONLY | 1725 | 838 | All SZGR 2.0 genes in this pathway |