Gene Page: NHLH1
Summary ?
| GeneID | 4807 |
| Symbol | NHLH1 |
| Synonyms | HEN1|NSCL|NSCL1|bHLHa35 |
| Description | nescient helix-loop-helix 1 |
| Reference | MIM:162360|HGNC:HGNC:7817|Ensembl:ENSG00000171786|HPRD:01212|Vega:OTTHUMG00000033121 |
| Gene type | protein-coding |
| Map location | 1q22 |
| Fetal beta | 0.584 |
Gene in Data Sources
| Gene set name | Method of gene set | Description | Info |
|---|---|---|---|
| CV:PGCnp | Genome-wide Association Study | GWAS | |
| PMID:cooccur | High-throughput literature-search | Systematic search in PubMed for genes co-occurring with SCZ keywords. A total of 3027 genes were included. | |
| GSMA_I | Genome scan meta-analysis | Psr: 0.0235 | |
| GSMA_IIA | Genome scan meta-analysis (All samples) | Psr: 0.00814 | |
| Literature | High-throughput literature-search | Co-occurance with Schizophrenia keywords: schizophrenia,schizophrenias | Click to show details |
| GO_Annotation | Mapping neuro-related keywords to Gene Ontology annotations | Hits with neuro-related keywords: 1 |
Section I. Genetics and epigenetics annotation
Section II. Transcriptome annotation
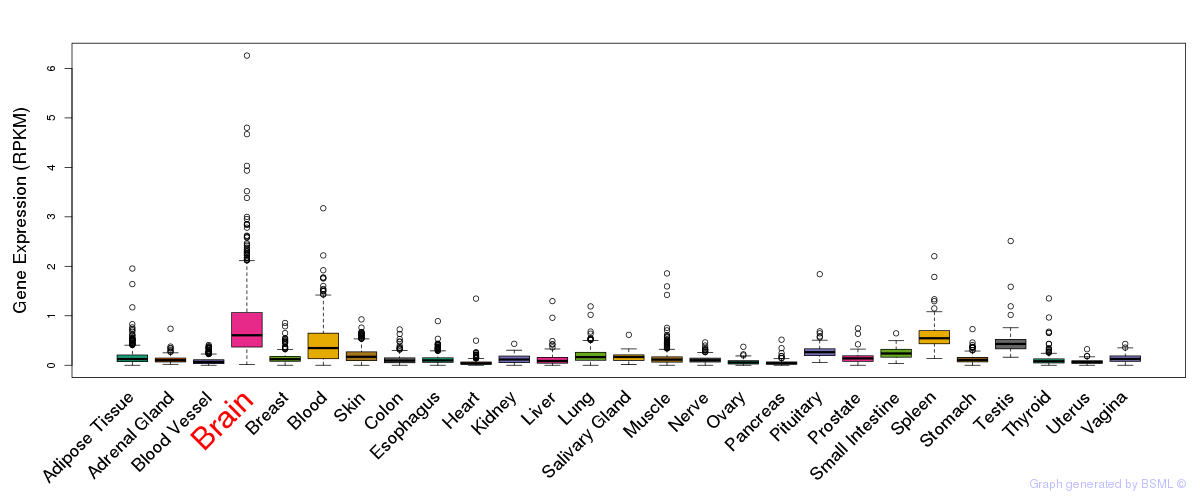
General gene expression (GTEx)
Gene expression during devlopment (BrainCloud)
Footnote:
A total of 269 time points ploted, with n=38 fetal samples (x=1:38). Each triangle represents one time point.
Gene expression of temporal and spatial changes (BrainSpan)
Footnote:
SC: sub-cortical regions; SM: sensory-motor regions; FC: frontal cortex; and TP: temporal-parietal cortex
ST1: fetal (13 - 26 postconception weeks), ST2: early infancy to late childhood (4 months to 11 years), and ST3: adolescence to adulthood (13 - 23 years)
The bar shown representes the lower 25% and upper 25% of the expression distribution.
Top co-expressed genes in brain regions
| Top 10 positively co-expressed genes | ||
| Gene | Pearson's Correlation | Spearman's Correlation |
| AC022532.3 | 0.96 | 0.95 |
| MMP25 | 0.76 | 0.72 |
| CLN3 | 0.73 | 0.71 |
| RAMP2 | 0.72 | 0.73 |
| PVRL2 | 0.72 | 0.68 |
| AC100793.2 | 0.71 | 0.70 |
| ISYNA1 | 0.71 | 0.77 |
| STRA6 | 0.71 | 0.73 |
| MOSPD3 | 0.70 | 0.70 |
| CPNE2 | 0.70 | 0.64 |
| Top 10 negatively co-expressed genes | ||
| Gene | Pearson's Correlation | Spearman's Correlation |
| GBP2 | -0.52 | -0.62 |
| RAPGEF4 | -0.52 | -0.61 |
| SEPT8 | -0.51 | -0.59 |
| BCL2L2 | -0.51 | -0.59 |
| CHN1 | -0.50 | -0.54 |
| CCNI2 | -0.50 | -0.56 |
| HLA-F | -0.50 | -0.51 |
| OMG | -0.49 | -0.61 |
| ANXA11 | -0.49 | -0.60 |
| FBXO2 | -0.49 | -0.53 |
Section III. Gene Ontology annotation
| Molecular function | GO term | Evidence | Neuro keywords | PubMed ID |
|---|---|---|---|---|
| GO:0003677 | DNA binding | IEA | - | |
| GO:0030528 | transcription regulator activity | IEA | - | |
| Biological process | GO term | Evidence | Neuro keywords | PubMed ID |
| GO:0007417 | central nervous system development | TAS | Brain (GO term level: 6) | 1328219 |
| GO:0006355 | regulation of transcription, DNA-dependent | IEA | - | |
| GO:0007275 | multicellular organismal development | IEA | - | |
| GO:0030154 | cell differentiation | IEA | - | |
| Cellular component | GO term | Evidence | Neuro keywords | PubMed ID |
| GO:0005634 | nucleus | IEA | - |
Section V. Pathway annotation
| Pathway name | Pathway size | # SZGR 2.0 genes in pathway | Info |
|---|---|---|---|
| DAVICIONI MOLECULAR ARMS VS ERMS UP | 332 | 228 | All SZGR 2.0 genes in this pathway |
| LEE NEURAL CREST STEM CELL UP | 146 | 99 | All SZGR 2.0 genes in this pathway |
| OUELLET CULTURED OVARIAN CANCER INVASIVE VS LMP DN | 35 | 20 | All SZGR 2.0 genes in this pathway |
| SCHLOSSER SERUM RESPONSE DN | 712 | 443 | All SZGR 2.0 genes in this pathway |
| KIM MYC AMPLIFICATION TARGETS UP | 201 | 127 | All SZGR 2.0 genes in this pathway |
| SHEN SMARCA2 TARGETS DN | 357 | 212 | All SZGR 2.0 genes in this pathway |
| TARTE PLASMA CELL VS PLASMABLAST UP | 398 | 262 | All SZGR 2.0 genes in this pathway |
| POMEROY MEDULLOBLASTOMA DESMOPLASIC VS CLASSIC DN | 59 | 35 | All SZGR 2.0 genes in this pathway |
| POMEROY MEDULLOBLASTOMA PROGNOSIS UP | 47 | 30 | All SZGR 2.0 genes in this pathway |
| IVANOVA HEMATOPOIESIS EARLY PROGENITOR | 532 | 309 | All SZGR 2.0 genes in this pathway |
| REN ALVEOLAR RHABDOMYOSARCOMA UP | 98 | 64 | All SZGR 2.0 genes in this pathway |
| XU GH1 EXOGENOUS TARGETS UP | 85 | 50 | All SZGR 2.0 genes in this pathway |
| LEIN CEREBELLUM MARKERS | 85 | 47 | All SZGR 2.0 genes in this pathway |
| RAY TUMORIGENESIS BY ERBB2 CDC25A UP | 104 | 57 | All SZGR 2.0 genes in this pathway |
| MIKKELSEN MEF LCP WITH H3K27ME3 | 70 | 35 | All SZGR 2.0 genes in this pathway |
| SENGUPTA EBNA1 ANTICORRELATED | 173 | 85 | All SZGR 2.0 genes in this pathway |
Section VI. microRNA annotation
| miRNA family | Target position | miRNA ID | miRNA seq | ||
|---|---|---|---|---|---|
| UTR start | UTR end | Match method | |||
| miR-124/506 | 668 | 674 | m8 | hsa-miR-506 | UAAGGCACCCUUCUGAGUAGA |
| hsa-miR-124brain | UAAGGCACGCGGUGAAUGCC | ||||
| miR-17-5p/20/93.mr/106/519.d | 1283 | 1289 | m8 | hsa-miR-17-5p | CAAAGUGCUUACAGUGCAGGUAGU |
| hsa-miR-20abrain | UAAAGUGCUUAUAGUGCAGGUAG | ||||
| hsa-miR-106a | AAAAGUGCUUACAGUGCAGGUAGC | ||||
| hsa-miR-106bSZ | UAAAGUGCUGACAGUGCAGAU | ||||
| hsa-miR-20bSZ | CAAAGUGCUCAUAGUGCAGGUAG | ||||
| hsa-miR-519d | CAAAGUGCCUCCCUUUAGAGUGU | ||||
- SZ: miRNAs which differentially expressed in brain cortex of schizophrenia patients comparing with control samples using microarray. Click here to see the list of SZ related miRNAs.
- Brain: miRNAs which are expressed in brain based on miRNA microarray expression studies. Click here to see the list of brain related miRNAs.